2027 Special Education Degree Persistence Report: Retention, Stop-Out Risk, and Re-Enrollment Patterns

Co-Founder and Chief Data Scientist
Special education degree students often balance clinical requirements, licensure exams, work, and family obligations, so persistence matters as much as admission. NCES reported in 2024 that first-year retention at 4-year institutions was 76% for first-time, full-time students, a reminder that many students leave before year two. This report is for prospective special education majors, transfer students, online learners, and returning adults who want to compare programs realistically. You will learn how retention, stop-out risk, re-enrollment policies, and support services affect your likelihood of staying enrolled and graduating.
Key Things You Should Know
- Retention is an early quality signal, but it is not the same as graduation: NCES reported a 76% first-year retention rate at 4-year institutions in 2024, so students should compare retention, completion, transfer, and re-enrollment policies together.
- Cost pressure is a major persistence risk: College Board's 2024 data lists average published tuition and fees at $11,610 for in-state public 4-year colleges and $43,350 for private nonprofit 4-year colleges, before housing, transportation, childcare, and lost work hours.
- Career demand can make persistence worthwhile, but not automatic: BLS data lists the median annual pay for special education teachers at about $64,270, while licensure rules, location, school setting, and degree level can affect both employment options and salary.
- What Do Retention Rates Reveal About Student Success in Special Education Degree Programs?
- Which Students Are Most at Risk of Stopping Out of a Special Education Degree Program?
What Do Retention Rates Reveal About Student Success in Special Education Degree Programs?
Retention rates show how many students continue from one academic period to the next, usually from the first fall to the second fall. In a special education degree program, retention can reflect whether students receive effective advising, early field-experience guidance, tutoring, financial aid support, and help meeting licensure requirements.
A high retention rate is generally encouraging, but it should not be treated as proof that every student graduates on time. Some students persist by transferring, switching from full-time to part-time, changing majors, pausing temporarily, or completing later than the standard timeline.
The table below explains the persistence metrics students should compare before choosing a special education program. These measures answer different questions, so the strongest decision comes from reading them together rather than relying on one number.
| Metric | What it Measures | Why it Matters for Special Education Students | How to Use it When Comparing Programs |
| First-year retention rate | Share of students who return after the first year | Shows whether new students are staying after introductory coursework, advising, and early field expectations | Use it as an early warning signal, especially if the program has demanding prerequisites or licensure checkpoints |
| Graduation rate | Share of students who complete within a defined period | Shows whether students move beyond early retention and actually finish the credential | Compare 4-year, 6-year, and part-time completion patterns when available |
| Stop-out rate | Share of students who leave temporarily without immediately transferring or graduating | Highlights risk from finances, workload, clinical placements, caregiving, or academic barriers | Ask whether the school tracks stop-outs and has a formal return plan |
| Re-enrollment rate | Share of stopped-out students who return | Shows whether the institution keeps pathways open for students who pause | Review leave-of-absence rules, course sequencing, and whether prior credits remain usable |
| Licensure completion indicators | Passage, placement, or program-completion data tied to teacher preparation | Connects persistence to the outcome many students actually need: eligibility for teaching licensure | Ask for state teacher-preparation reports, accreditation status, and field-placement completion data |
Special education students should give extra weight to retention in the first two years because many programs introduce child development, disability law, assessment, behavior support, and classroom observation early. If students are not supported during this stage, later clinical teaching and licensure requirements can become harder to complete.
The most reliable programs do not simply advertise a high retention rate. They explain who is retained, which students are leaving, what support is available before students stop out, and how the program helps returning students regain academic momentum.
Which Students Are Most at Risk of Stopping Out of a Special Education Degree Program?
Students most at risk of stopping out are usually not less motivated. More often, they face a mismatch between program design and life conditions, such as unpaid fieldwork hours, inconsistent course scheduling, family responsibilities, limited transportation, or financial aid gaps.
Special education programs can be particularly demanding because students must build academic knowledge while developing classroom management, individualized education program documentation, assessment literacy, and collaboration skills. These expectations can be manageable with strong advising, but they can become stop-out triggers when students do not know what is coming next.
The table below summarizes common risk patterns. It is meant to help students identify challenges early, not to label any student as unlikely to succeed.
| Student Situation | Why Stop-Out Risk Can Increase | What to Check Before Enrolling |
| Working adults | Course loads, practicum hours, and student-teaching schedules may conflict with job responsibilities | Evening, weekend, hybrid, or part-time options; employer flexibility; field-placement timing |
| Parents and caregivers | Unpredictable caregiving needs can interrupt attendance, assignments, and clinical hours | Leave policies, flexible deadlines, childcare resources, and predictable course calendars |
| First-generation students | Hidden requirements, licensure paperwork, and financial aid processes may be harder to navigate | Proactive advising, first-generation mentoring, and clear degree maps |
| Transfer students | Credits may not apply cleanly to licensure-aligned education sequences | Official transfer evaluation before enrollment and a written completion plan |
| Online students | Flexible courses can still require in-person fieldwork and state-specific placement approvals | Local placement support, synchronous requirements, technology expectations, and licensure alignment |
| Students with financial uncertainty | Small unpaid balances, delayed aid, or required testing fees can block registration | Emergency grants, payment plans, scholarship deadlines, and total cost beyond tuition |
One common mistake is assuming that academic ability is the only thing that determines persistence. In reality, a student with strong grades can still stop out if the program's clinical schedule is incompatible with work, if transportation to placements is unreliable, or if a required course is offered only once per year.
Students can reduce stop-out risk by asking specific questions before they enroll. The goal is to make hidden requirements visible while there is still time to choose a better fit.
- Ask when field observations, practicums, and student teaching begin, and whether they require weekday daytime availability.
- Request a term-by-term degree map that includes general education, major courses, licensure tests, and clinical milestones.
- Ask how many credits transfer directly into the special education major, not just into general electives.
- Confirm whether the program has a formal process for students who need to pause and return.
- Ask whether advisors contact students after missed assignments, failed gateway courses, unpaid balances, or registration delays.
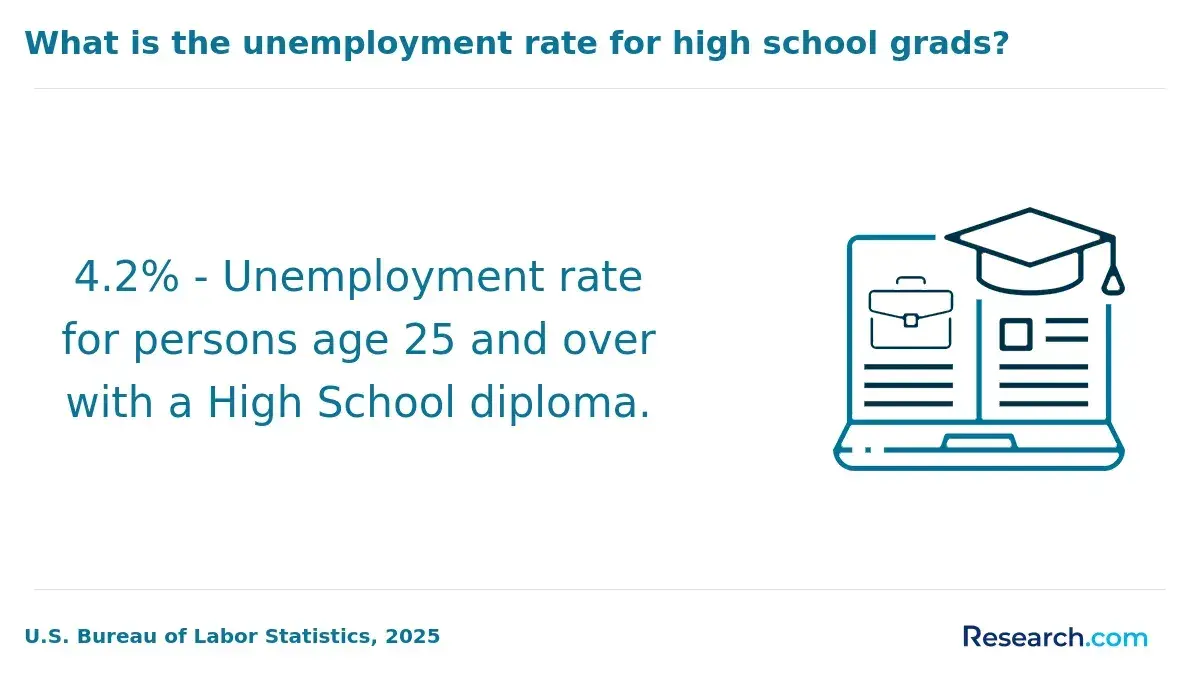
Academic and financial challenges often interact. A student who is short on money may work more hours, take fewer credits, lose access to a course sequence, and delay field placement. A student who fails a prerequisite may need an extra term, which increases cost and may affect financial aid eligibility.
College Board's 2024 pricing data shows why persistence planning is also a financial decision: average published tuition and fees were $11,610 for in-state students at public 4-year institutions and $43,350 at private nonprofit 4-year institutions. These figures do not include every expense, so students should calculate the full cost of staying enrolled through clinical teaching, not just the first semester bill.
Students comparing education with healthcare paths, such as online pharmacy programs, should pay close attention to the same completion issue: a lower advertised tuition price may not be the best value if poor scheduling, limited advising, or delayed clinical requirements extend the time to finish.
The table below shows common persistence barriers and how they affect special education degree completion. These are practical risk factors to discuss with admissions, financial aid, and academic advising before committing to a program.
| Challenge | How it Can Reduce Persistence | Program Feature That Can Help |
| Gateway course failure | Blocks entry into upper-division education courses or clinical experiences | Embedded tutoring, early alerts, course repeats, and advisor intervention |
| Unclear licensure requirements | Students may miss testing, background check, or field-hour deadlines | Licensure checklist updated by state and reviewed every term |
| Unpaid or daytime fieldwork | Creates conflict for students who work or provide care | Early placement planning and flexible field-site coordination where allowed |
| Small unpaid balances | Can prevent registration even when the student is academically eligible | Emergency aid, payment plans, and proactive financial counseling |
| Course sequencing gaps | A missed course may not be available again until a later term | Multiple course starts, summer options, and clear rotation calendars |
| Licensure exam delays | May postpone student teaching or graduation eligibility | Test preparation, fee support, and clear testing timelines |
A major red flag is a school that discusses tuition but cannot explain total program cost through student teaching. Special education majors should ask about background checks, testing fees, transportation, technology, professional liability insurance, textbooks, and any unpaid fieldwork requirements.
Before enrolling, students should build a persistence budget rather than a first-term budget. That budget should include predictable costs, emergency margin, and the financial effect of reducing work hours during field placement or student teaching.
Stopping out means leaving school temporarily without completing the degree. It is different from formally withdrawing permanently, transferring, or graduating. For special education students, a stop-out may happen because of financial pressure, health issues, caregiving, academic difficulty, work conflicts, or field-placement barriers.
A temporary stop-out does not always end a student's path, but it can make graduation more complicated. Course sequences may change, licensure rules may be updated, financial aid eligibility may shift, and clinical placements may need to be restarted.
The table below outlines common re-enrollment patterns. Students who may need a break should understand these pathways before leaving, because the easiest return is usually planned before the pause begins.
| Return Pattern | What Usually Happens | Potential Persistence Issue | What Students Should Confirm |
| Short planned leave | Student pauses for one term and returns under an approved plan | Missed course sequence may delay progress | Whether the next required course is available when the student returns |
| Financial stop-out | Student leaves because of unpaid balances, aid gaps, or work demands | Registration holds and debt can block re-entry | Payment plan, emergency aid, and satisfactory academic progress status |
| Academic stop-out | Student leaves after failing or withdrawing from key courses | Repeat limits, GPA requirements, or program dismissal rules may apply | Academic recovery plan and whether tutoring or course repeats are available |
| Clinical placement interruption | Student cannot complete fieldwork or student teaching during the planned term | Placement availability and background checks may need to be renewed | Whether the program can place the student in a future term without restarting major requirements |
| Transfer after stop-out | Student returns through a different institution | Credits may transfer as electives instead of licensure requirements | Written transfer evaluation and state licensure alignment |
Students should avoid simply disappearing from a program. Informal stopping out can create transcript holds, financial aid problems, missed deadlines, and confusion about whether the student is eligible to return.
Before taking a break, students should complete a short re-entry plan. This plan should reduce uncertainty and protect as many earned credits as possible.
- Meet with an academic advisor and identify the exact courses still required for graduation and licensure.
- Ask whether a formal leave of absence is available and how long it protects catalog requirements.
- Check financial aid status, loan repayment timing, unpaid balances, and satisfactory academic progress rules.
- Confirm whether fieldwork, background checks, test scores, or clinical approvals expire during the break.
- Set a specific re-enrollment term and ask what action is required before registration opens.
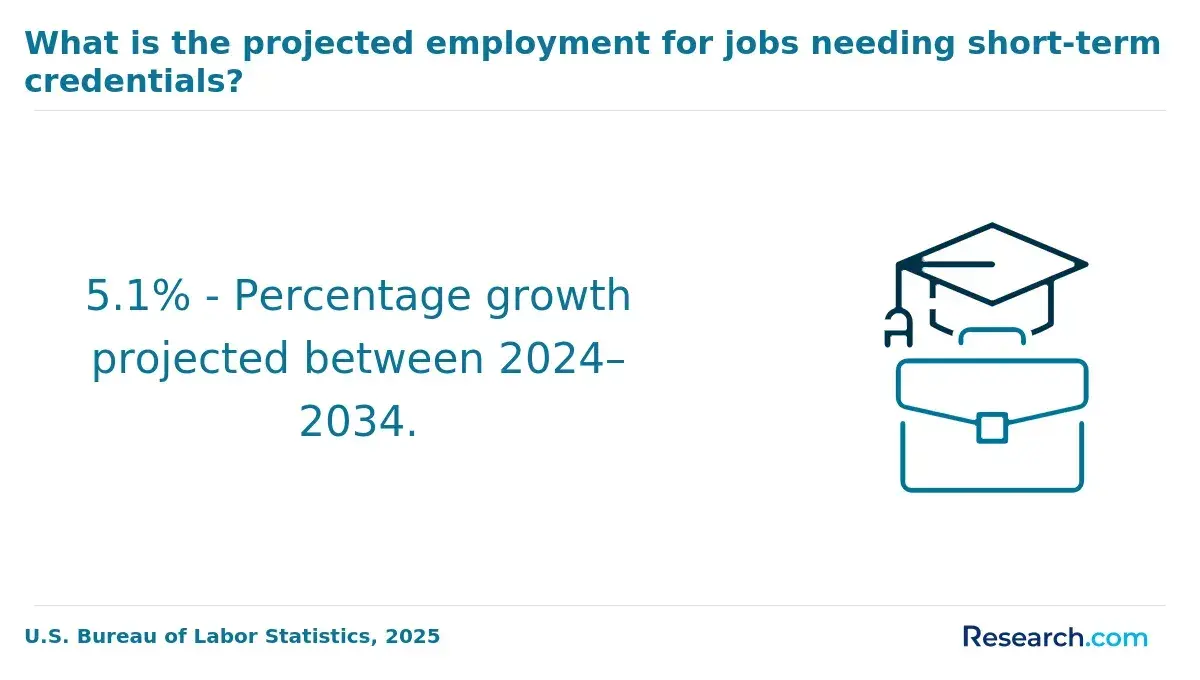
Support services improve persistence when they are timely, specific, and connected to the requirements of the special education major. General student support is helpful, but special education students often need targeted guidance around field placements, licensure exams, disability law coursework, behavior-support assignments, and classroom documentation.
The most effective programs do not wait for students to fail before reaching out. They use advising milestones, early-alert systems, tutoring referrals, financial counseling, and placement planning to identify risk while there is still time to respond.
The table below connects common support services to the persistence problems they are designed to reduce. Students should ask not only whether a service exists, but how often students use it and whether online, transfer, and part-time students have equal access.
| Support Service | Persistence Problem it Addresses | What Strong Implementation Looks Like |
| Proactive academic advising | Missed prerequisites, delayed registration, and unclear licensure steps | Required advising before registration and a term-by-term completion map |
| Early-alert systems | Silent academic struggle before midterms or withdrawal deadlines | Faculty alerts followed by advisor outreach, tutoring, or success coaching |
| Special education faculty mentoring | Difficulty connecting theory, practice, and classroom expectations | Regular mentoring tied to fieldwork, behavior support, assessment, and IEP-related assignments |
| Tutoring and writing support | Struggles in research, assessment, case-study writing, and documentation | Support available before major assignments and not only after low grades |
| Financial aid counseling | Registration holds, aid gaps, and confusion about part-time eligibility | Clear cost forecasts, emergency aid referrals, and satisfactory academic progress guidance |
| Clinical placement coordination | Delays caused by school-site availability, background checks, or transportation | Early placement timelines and staff who help solve site problems |
| Licensure exam preparation | Testing delays that postpone student teaching or graduation | Practice materials, workshops, fee guidance, and testing calendars |
A common mistake is assuming that a program with many student services automatically has strong persistence outcomes. Services matter most when they are integrated into the degree plan and activated before a student is already near stopping out.
Students should ask direct questions during program evaluation. Good programs should be able to answer them with clear processes, not vague assurances.
- How often will I meet with an advisor who understands special education licensure requirements?
- What happens if I fail a prerequisite or miss a clinical placement deadline?
- Are tutoring, writing support, and licensure exam preparation available to online and part-time students?
- Who helps arrange field placements, and how early does that process begin?
- Does the program contact students who stop registering, miss assignments, or develop unpaid balances?
Persistence affects graduation time because special education programs often rely on sequenced courses and clinical milestones. Missing one requirement can delay the next practicum, student-teaching placement, or licensure application, especially if courses are offered only once per year.
BLS data places the median annual pay for special education teachers at about $64,270, but that figure should be interpreted carefully. Pay can vary by state, school district, grade level, union contract, advanced credentials, and years of experience, so persistence should be evaluated alongside the cost and time required to reach licensure.
Students comparing teaching with related helping-profession or wellness pathways, such as an online degree in exercise science, should compare not only salary data but also clinical requirements, licensure rules, student support, and time-to-completion risk.
The table below shows how enrollment patterns can affect time to degree. It is a planning tool, not a promise, because course availability, transfer credits, failed courses, and clinical placements can change individual timelines.
| Enrollment Pattern | Typical Effect on Graduation Time | Career Planning Implication | Main Risk to Manage |
| Consistent full-time enrollment | Most likely to follow the standard degree map | Earlier eligibility for student teaching and licensure application | Burnout or schedule conflict during intensive terms |
| Consistent part-time enrollment | Usually extends the timeline but may improve sustainability | Later entry into full-time teaching roles, but lower risk of overload | Loss of momentum over a longer period |
| Temporary planned leave | May add one or more terms depending on course sequence | Career entry may be delayed, but credits are more likely to remain organized | Returning when required courses are not offered |
| Unplanned stop-out | Can create unpredictable delays | Licensure tests, field placements, or catalog requirements may need review | Financial holds, expired requirements, or unclear re-entry steps |
| Transfer after earning credits | Can shorten or lengthen time depending on credit applicability | May improve fit, but licensure alignment must be verified | Credits accepted as electives rather than major requirements |
Graduating later can increase total cost through additional tuition, fees, commuting, childcare, and opportunity cost. However, forcing full-time enrollment when life circumstances make it unrealistic can be more expensive if it leads to failed courses or a stop-out.
The best persistence strategy is not always the fastest path. It is the path a student can sustain through coursework, clinical experiences, licensure testing, and the final transition into the classroom.
The special education degree programs with the strongest persistence outcomes are usually not identifiable by one public statistic. Program-level retention data for special education majors is not always reported uniformly, so students should combine institution-wide retention, teacher-preparation indicators, accreditation, support design, and licensure alignment.
Strong programs tend to make requirements visible early. They show students how general education, special education methods, assessment, behavior support, reading instruction, classroom management, fieldwork, and student teaching fit together from the first term to graduation.
The table below describes program characteristics that are associated with stronger persistence conditions. It helps students compare programs even when schools do not publish a special-education-only retention rate.
| Program Feature | Why it Supports Persistence | Evidence or Documentation to Request |
| State-approved licensure pathway | Reduces risk that students complete coursework that does not meet certification requirements | State approval listing and licensure disclosure for the student's state |
| CAEP or recognized educator-preparation accreditation, where applicable | Signals that the program has been reviewed against educator-preparation standards | Current accreditation status and any public outcome reports |
| Transparent degree map | Helps students avoid missed prerequisites and delayed clinical placements | Term-by-term plan for full-time, part-time, transfer, and online students |
| Early field experience | Helps students confirm career fit before reaching student teaching | Field-hour schedule and school-partner information |
| Dedicated clinical placement office | Reduces delays in practicum and student teaching assignments | Placement process, geographic limits, and support for online learners |
| Licensure exam support | Helps prevent testing delays that can interrupt progression | Pass-rate context, test-prep resources, and retake support |
| Re-enrollment pathway | Improves the chance that students who pause can return without starting over | Leave-of-absence policy, catalog protection rules, and credit time limits |
Students should be cautious with programs that promote flexibility but cannot explain field placement logistics. In special education, flexibility in coursework is only useful if clinical requirements, state licensure rules, and student-teaching schedules are also manageable.
When comparing programs, students can use a short screening process to identify stronger persistence conditions before applying.
- Confirm that the program is approved for the licensure area and state where you plan to teach.
- Ask for retention and graduation data at the institution level and teacher-preparation outcome data when available.
- Request a written degree map based on your enrollment status, transfer credits, and preferred start term.
- Review support services specifically for education majors, not only general campus services.
- Ask how the program helps students who fail a licensure exam, lose a placement, or need to pause enrollment.
Persistence patterns in special education degree programs are changing as more students seek flexible learning, more adults return to college, and more teacher-preparation programs use online or hybrid coursework. These changes can improve access, but they also make advising, placement coordination, and licensure transparency more important.
AI and education technology are also changing student support. Schools are increasingly using early-alert dashboards, online tutoring, degree-audit systems, and predictive advising to identify students who may be at risk of stopping out. These tools can help, but they should not replace human advising, especially when a student is dealing with finances, caregiving, disability accommodations, or clinical placement issues.
Credential-based hiring is another trend worth watching across fields, including technical pathways where students may compare outcomes such as bioinformatics degree jobs. For special education students, the equivalent issue is licensure alignment: the degree must connect clearly to the credential required by the state and the school setting.
The table below summarizes major trends and how they affect persistence decisions. Students should use these trends to ask better questions, not to assume that any format or technology automatically improves completion.
| Trend | How it May Help Persistence | What Students Should Watch For |
| Growth of online and hybrid coursework | Improves access for working adults, rural students, and caregivers | Clinical placements may still be in person and state-specific |
| More adult and transfer learners | Programs may offer more flexible pathways and credit evaluation | Transfer credits may not fit licensure sequences cleanly |
| Early-alert and predictive advising tools | Can identify registration, attendance, or grade risks earlier | Alerts are only useful if staff follow up with real support |
| Rising college costs | Encourages students to compare total cost and time-to-degree more carefully | Students may underestimate unpaid fieldwork and reduced work hours |
| Greater attention to teacher shortages | May expand scholarships, residency models, or district partnerships in some areas | Incentives can have service commitments or location restrictions |
| State licensure updates | May modernize requirements or create new pathways | Rules vary by state and may change during a student's enrollment |
A current red flag is a program that markets online convenience without clearly disclosing licensure limits. Students should look for state authorization information, field-placement support, and written confirmation that the program matches the license they want.
The strongest programs will likely be those that combine flexibility with structure: online access where appropriate, predictable clinical pathways, proactive advising, clear licensure disclosures, and re-entry systems for students whose lives do not follow a perfect 4-year plan.
Students should evaluate special education degree programs by asking one central question: does this program make it realistic for me to stay enrolled, recover from setbacks, complete clinical requirements, and qualify for licensure in my state? Retention is part of the answer, but it is not the whole answer.
A practical evaluation should compare academic fit, financial fit, schedule fit, support quality, and re-enrollment flexibility. The goal is to choose a program that reduces predictable barriers before they become reasons to stop out.
The table below shows how to interpret common program signals. It can help students move beyond marketing language and focus on evidence that affects persistence.
| Signal to Review | Positive Sign | Red Flag | Decision Use |
| Retention and graduation data | School explains trends and support strategies clearly | Only broad claims are provided without context | Use as an early indicator, not a guarantee |
| Licensure alignment | Program provides state-specific disclosures and approval status | School says requirements are "usually accepted" without documentation | Do not enroll until alignment is confirmed in writing |
| Field placement support | Placement process starts early and includes online students | Students are mostly responsible for finding their own sites | Critical for students outside the campus region |
| Course sequencing | Required courses are mapped by term and available predictably | Missed courses may delay students by a year | Important for part-time, transfer, and working students |
| Financial transparency | Total cost includes fees, testing, transportation, and fieldwork impacts | Only tuition per credit is discussed | Use to estimate whether you can persist through student teaching |
| Re-enrollment policy | Formal leave and return procedures are clear | Students must reapply without knowing how credits will count | Essential if work, family, or health issues may interrupt enrollment |
Students should follow a structured process before committing. These steps are especially important for online, transfer, part-time, and working adult students.
- Collect retention, graduation, and teacher-preparation outcome data from each school, and ask how the program supports students who fall behind.
- Verify accreditation, state approval, and licensure alignment for the exact state and special education credential you want.
- Request a personalized degree plan that includes transfer credits, course sequence, fieldwork, student teaching, and licensure testing.
- Calculate total cost through graduation, including fees, transportation, lost work hours, childcare, testing, and possible extra terms.
- Compare online, campus, hybrid, full-time, and part-time formats against your actual weekly schedule.
- Ask about tutoring, mentoring, early alerts, emergency aid, disability services, and re-enrollment after a stop-out.
- Choose the program that gives you the clearest path to completion, not just the lowest tuition or most convenient first semester.
The best decision is usually not based on one impressive statistic. It comes from finding a program whose structure matches your academic preparation, finances, schedule, support needs, and licensure goal.
Learning format and enrollment status shape persistence because they determine how school fits into daily life. Online learning can improve access for working adults and rural students, while campus-based learning may provide more immediate peer connection, faculty access, and placement coordination.
The same trade-off appears in other career-focused credentials; students researching an LPN 6 month program often find that faster formats require stricter time availability, and special education students should apply the same caution to accelerated or compressed education pathways.
The table below compares common format and enrollment choices. It does not rank one option as universally better, because the best persistence fit depends on schedule stability, support needs, field-placement access, and learning preferences.
| Option | Persistence Advantage | Persistence Risk | Best Fit |
| Full-time enrollment | Faster momentum and easier access to sequenced courses | Higher weekly workload and greater conflict with employment or caregiving | Students with stable finances, predictable schedules, and time for fieldwork |
| Part-time enrollment | More manageable for working adults and caregivers | Longer time to degree and greater risk that life events interrupt progress | Students who need flexibility and can follow a written long-term course plan |
| Online coursework | Reduces commuting and can support students outside campus areas | May still require in-person clinical placements and strong self-management | Self-directed students with reliable technology and local placement options |
| Campus coursework | More direct access to faculty, peers, tutoring, and campus resources | Commute time and fixed class schedules may reduce flexibility | Students who benefit from structured routines and face-to-face support |
| Hybrid format | Combines online flexibility with in-person practice and community | Requires careful scheduling around both online deadlines and campus meetings | Students who want flexibility but still need structured contact |
| Accelerated format | Can shorten time to degree for prepared students | Less recovery time after academic, work, or family disruptions | Students with strong preparation, low schedule volatility, and clear financial support |
Full-time enrollment usually supports faster completion when students have the time and finances to sustain it. Part-time enrollment can be the smarter persistence choice when a student would otherwise overextend, fail a gateway course, or stop out after one overloaded term.
Online special education programs require careful review because licensure is state-specific. Students should confirm whether the program leads to licensure in their state, whether the school helps arrange local field placements, and whether online students receive the same advising, tutoring, test preparation, and early-alert support as campus students.
To choose the right format, students should compare their real weekly availability with the program's expectations. A realistic schedule is one of the strongest persistence tools a student can build before the first class begins.
Other Things You Should Know About Special Education
Retention rate is useful because it shows whether students return after the first year, but graduation rate is closer to the final outcome. Use both together, along with licensure alignment, field-placement support, and re-enrollment policies.
No. Many students return after a planned or unplanned break, but returning is easier when you speak with an advisor, protect your credits, resolve financial holds, and confirm when required courses and field placements are available again.
Not necessarily. Online programs can support persistence for students who need flexibility, but they still require strong self-management and usually include in-person fieldwork. Confirm licensure eligibility and placement support before enrolling.
A major red flag is unclear licensure or field-placement information. If a program cannot explain how coursework, clinical hours, student teaching, testing, and state approval fit together, your risk of delay or stop-out may be higher.
- Racial Disproportionality in Special Education: Causes, Outcomes and ... https://educate.bankstreet.edu/cgi/viewcontent.cgi
- Financial Aid Strategies That Support Adult Learners - ReUp Education https://reupeducation.com/resources/financial-aid-strategies/
- Stopping Out (Again) – FAFSA Delays May Have Outsized Impact on Vulnerable Student Populations https://tytonpartners.com/stopping-out-again-fafsa-delays-may-have-outsized-impact-on-vulnerable-student-populations/
- Publications https://michaelshill.net/publications/
- Do your graduate and online programs offerings match what students actually want? | EAB https://eab.com/resources/blog/adult-education-blog/do-your-graduate-and-online-programs-offerings-match-what-students-actually-want/
- Student Retention in Hybrid Accelerated Health Care Programs: Challenges and Strategies https://eimpartnerships.com/articles/student-retention-in-hybrid-accelerated-health-care-programs-challenges-and-strategies
- Removing Barriers for Students to Re-Enroll https://decisions.com/blog/student-re-enrollment
- Trend Analysis Of Selected Special Education Transition Factors On The ... https://digitalscholarship.tsu.edu/cgi/viewcontent.cgi