2027 Statistics Admissions Trends Report: Acceptance Rates, GPA Expectations, and Test Policy Changes

Co-Founder and Chief Data Scientist
Increasing demand for data-driven decision-making has intensified pressure on statistics programs to balance enrollment growth with maintaining rigorous academic standards. Programs increasingly navigate constrained faculty resources and evolving accreditation criteria that influence acceptance rates and GPA expectations. Changes in standardized testing policies reflect shifting priorities toward assessing quantitative reasoning over traditional exam scores, aligning admissions with workforce competencies. These metrics reveal how programs adapt to labor market demand for graduates skilled in advanced analytics and interpretation. Notably, the age diversity among incoming cohorts suggests broader accessibility and evolving career pathways, highlighting how statistics education interfaces with professional development and sector-specific needs.
Key Things to Know About Statistics Admissions Trends
- Acceptance rates for statistics programs dropped by 12% since 2023 due to increased applicant volume, heightening competition and requiring clearer strategic planning for applicant differentiation.
- Average admitted GPA rose to 3.7 in 2024, reflecting employer demand for strong quantitative foundations, pressuring applicants to prioritize rigorous coursework timing even if it delays graduation.
- Widespread test-optional policies have expanded access but complicate admissions forecasts; this tradeoff shifts emphasis toward holistic review, affecting how applicants showcase analytical potential without standardized test data.
- Key Things to Know About Statistics Admissions Trends Key Things to Know About Statistics Admissions Trends
- What Are the Current Acceptance Rates for Statistics Degree Programs? Current Acceptance Rates
- What Is the Average GPA of Accepted Statistics Students? GPA Requirement
- Are SAT or ACT Scores Still Required for Statistics Degree Programs? SAT/ACT Requirement
- How Many Statistics Programs Have Adopted Test-Optional Admissions Policies? Test-Optional Programs
- What Non-Academic Factors Do Statistics Admissions Committees Consider? What Non-Academic Factors Do Statistics Admissions Committees Consider?
- Which Types of Schools Are the Most Selective for Statistics Applicants? Which Types of Schools Are the Most Selective for Statistics Applicants?
- How Do Admissions Standards Differ Across States and Regions? Admission Standards by State
- How Do Admissions Requirements Compare Between Online and Campus Programs? Online vs On-Campus Admissions
- Is There a Relationship Between Admissions Standards and Student Success? Admission Standards & Student Success
- How Can Students Strengthen a Statistics Program Application? Program Application Preparation
What Are the Current Acceptance Rates for Statistics Degree Programs?
Acceptance rates for statistics degree programs in the United States in 2024 show considerable variation, with undergraduate programs typically accepting between 40% and 70% of applicants according to data derived from the U.S. Department of Education's College Scorecard and institutional reports. More selective universities with strong quantitative departments report acceptance figures below 30%, reflecting greater competitiveness driven by high applicant interest and limited spots. Graduate-level admissions are notably more restrictive, with master's and doctoral statistics programs accepting roughly 15% to 35% of candidates, a narrow window influenced by funding limitations and faculty supervision capacity. These figures highlight distinct enrollment dynamics and selectivity differences shaped by institution type and program level, an important factor for prospective students evaluating access and competition trends across statistics degree programs by region.
Variability in acceptance rates stems largely from institutional prestige, program capacity, and the interplay between public and private school resources. Public universities with expansive STEM faculties tend to show higher acceptance due to larger program sizes, whereas private or highly ranked schools operate under tighter selectivity constraints. Regional demand also plays a role, as programs in tech or finance hubs attract more applicants, pressuring acceptance rates downward. Additionally, emerging trends in interdisciplinary programs combining statistics with data science or biostatistics can affect these rates, often slightly increasing acceptance as new curricula respond to workforce needs. For students and advisors, understanding these nuanced differences offers a clearer picture of how acceptance rates reflect both supply constraints and the evolving appeal of statistics education.
These acceptance patterns underscore broader competitive pressures in the statistics admissions landscape and suggest strategic positioning is crucial for applicants. GPA thresholds typically serve as an initial filter, with undergraduate programs favoring GPAs above 3.0 and graduate programs emphasizing 3.3 or higher in quantitative subjects. However, practical skills, research experience, and application materials increasingly influence admissions decisions beyond raw acceptance numbers. Prospective students may also consider alternatives such as PhD online programs for flexibility amid this selectivity. Ultimately, analysis of acceptance rates should account for how institutional characteristics and broader market demands shape both the accessibility and perceived value of statistics degree pathways.
What Is the Average GPA of Accepted Statistics Students?
Recent admissions data from institutional profiles and U.S. Department of Education datasets reveal that the average GPA for accepted statistics students in the US generally falls between 3.4 and 3.8 on a 4.0 scale, capturing the middle 50% of incoming cohorts. Some highly selective programs report accepted GPAs trending above 3.7, reflecting intensified competition and heightened academic standards. This GPA range signals a baseline of academic preparedness aligned with the quantitative rigor expected in statistics curricula, where proficiency in mathematics and analytical coursework is critical. These metrics serve as benchmarks not only of individual achievement but also of institutional selectivity, beyond simple threshold requirements.
GPA expectations vary according to institutional factors such as public versus private status, program demand, and regional grading conventions. More research-intensive or STEM-focused universities often weigh performance in quantitative subjects heavily, sometimes compensating for slightly lower overall GPAs when core math courses are strong. Conversely, many programs with broader access goals or those integrated within online learning platforms may present a wider GPA range among admittees, reflecting expanded holistic review practices. Transfer applicants must therefore understand how these variations influence GPA comparability and admissions signaling across diverse statistics programs.
These GPA thresholds actively shape applicant behavior, encouraging stronger preparation in calculus, linear algebra, and related fields, which enhances competitiveness in a growing admissions pool. Prospective students and advisors should interpret GPA not simply as a numeric cutoff but as a reflection of how programs balance academic rigor with holistic evaluation in a shifting admissions landscape. As demand for statistics expertise grows across industries, applicants targeting top-tier programs benefit from exceeding average accepted GPAs, ensuring alignment with employer expectations and program outcomes linked to quantitative proficiency and applied analytical skills. For those exploring alternatives, insights gained from research in business degree admissions strategies may also inform sound decision-making.
Are SAT or ACT Scores Still Required for Statistics Degree Programs?
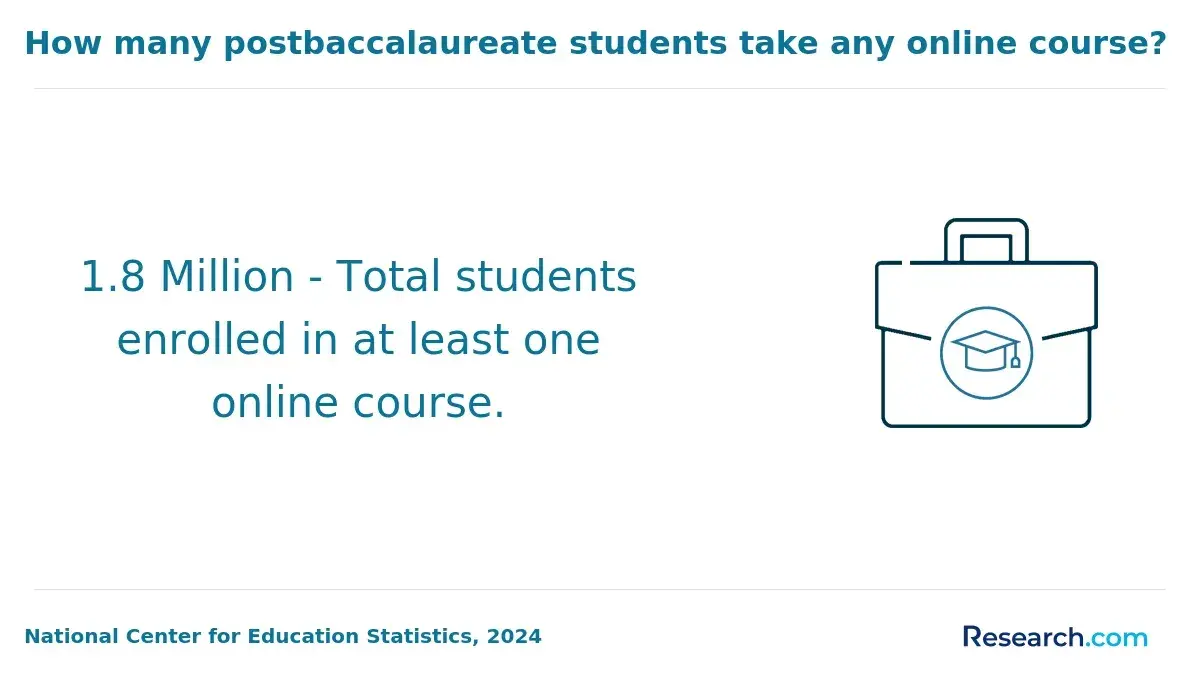
For 2024 and subsequent admissions cycles, a majority of Statistics degree programs no longer mandate SAT or ACT scores, reflecting data from institutional reports and the National Center for Education Statistics. Many universities have shifted toward test-optional policies, where submissions of standardized test results are permitted but not required, particularly within STEM disciplines like statistics. This trend highlights a broader move by over 60% of four-year institutions to detach admission decisions from sole reliance on test scores, prioritizing academic records and quantitative coursework credentials instead. Programs emphasize demonstrated mathematical proficiency through GPA, advanced coursework, and holistic assessments rather than standardized exams.
The reduction in standardized testing requirements stems from multiple intersecting factors, including increasing awareness of the equity limitations inherent in SAT/ACT exams and the desire by institutions to broaden access for diverse applicant pools. Highly selective universities may still consider test scores when submitted but tend to weigh them alongside other indicators such as letters of recommendation and specialized coursework. Public and private institutions vary in their adoption pace of these policies, influenced by enrollment goals and ranking pressures. Consequently, the role of SAT/ACT results in admissions frameworks is evolving-less a gatekeeping measure and more an optional data point used variably depending on selectivity and institutional priorities.
A current statistics student recalled waiting to submit SAT scores after a delay in test center dates complicated their timeline during early admission consideration. They hesitated to send scores initially, unsure if it would strengthen their application given the test-optional stance, yet felt pressure as some programs listed score submissions as "recommended." This uncertainty led to last-minute decisions balancing the practicalities of application timing against perceived admissions weight, illustrating the nuanced impact of changing testing policies on individual strategic planning and stress during competitive admissions cycles.
How Many Statistics Programs Have Adopted Test-Optional Admissions Policies?
By early 2024, estimates indicate that between 45% and 55% of U.S. institutions offering statistics programs have adopted test-optional admissions policies, a shift documented by FairTest and supported by data from the College Board and the National Center for Education Statistics. This significant portion reflects a tangible movement away from the traditional reliance on SAT or ACT scores, particularly within smaller private colleges and public universities, while larger research universities have been more cautious but show signs of gradual alignment with this trend. Over 500 institutions with statistics majors or minors have embraced more flexible testing requirements, underscoring a marked evolution in admissions practices in response to changing educational and societal dynamics.
The adoption of test-optional policies in statistics programs is driven largely by equity considerations and the reevaluation of standardized testing's predictive value for academic success. The COVID-19 pandemic accelerated this reassessment by disrupting standardized testing availability, pushing institutions to emphasize holistic factors such as GPA and coursework rigor instead. Additionally, pressures from applicants and their advisors for more accessible admissions criteria reflect shifting expectations in the recruitment landscape, especially as programs seek to diversify their student populations without compromising academic standards. The interplay of institutional competition and the desire to broaden access underpins many admissions offices' decisions to reduce reliance on testing metrics.
This transition carries nuanced implications for application patterns and institutional selectivity within statistics programs. Test-optional policies often lead to increased application volumes, complicating admissions decisions and sometimes altering traditional benchmarks used to gauge candidate readiness. Consequently, prospective students must navigate admissions landscapes where standardized test submissions are optional but may still influence considerations in certain contexts. Institutions balancing fairness, rigor, and competitiveness illustrate a broader recalibration of admissions strategies that will likely continue to evolve as data on long-term outcomes from test-optional cohorts emerges.
What Non-Academic Factors Do Statistics Admissions Committees Consider?
Admissions decisions in statistics degree programs are shaped by a combination of academic credentials and a nuanced evaluation of non-academic factors. This holistic review process extends beyond GPA and test scores to assess an applicant's broader potential to thrive in both rigorous coursework and collaborative research environments. Committees actively seek personal qualities and experiences that complement technical aptitude, ensuring a diverse and resilient student body. Recognizing these dimensions is crucial for understanding how statistics admissions committees differentiate candidates in increasingly competitive applicant pools.
- Recommendation Letter Substance: Strong letters provide insight into an applicant's work ethic, intellectual curiosity, and teamwork capacity, often revealing attributes not captured by grades alone. Admissions reviewers rely on detailed endorsements to gauge how students might adapt to challenging statistical inquiry and dynamic, data-driven projects.
- Relevant Professional or Research Experience: Practical exposure to internships, data analysis roles, or research projects signals applied knowledge and readiness for graduate-level demands. Nearly 45% of top-tier programs weigh such experience heavily, reflecting correlations with successful employment outcomes post-graduation in analytics and related fields.
- Diversity and Background Factors: Committees consider socioeconomic status, underrepresented identities in STEM, and first-generation college attendance to promote an inclusive learning environment that broadens perspectives and innovation. Approximately 72% of programs have increased recruitment efforts targeting diverse populations, understanding that varied backgrounds enhance classroom dialogue and research creativity.
- Leadership and Communication Skills: The inherently collaborative nature of statistics calls for clear communication and stakeholder engagement. Evidence of leadership-whether in academic organizations or community initiatives-demonstrates persistence and the ability to contribute meaningfully in team-oriented settings essential to professional statistics work.
- Extracurricular Commitment: While not a standalone predictor of admission, sustained engagement in relevant extracurricular activities can illustrate initiative and time management. Admissions committees evaluate these activities contextually, considering how involvement complements technical skills and academic potential, especially when numerical metrics are comparable among applicants.
Integrating these non-academic evaluation criteria reveals how statistics admissions committees strive to construct cohorts that balance technical proficiency with qualities predictive of long-term success. This process highlights the importance for prospective students to strategically align their application materials, encompassing both academic achievement and a thoughtful presentation of their unique experiences and skills.
For more information about educational pathways integrating practical demands and market realities in related fields, consider exploring options such as an online degree social media marketing, which also emphasize the intersection of applied skills and strategic communication.
statistics admissions committees non-academic evaluation criteria
impact of extracurricular activities on statistics admission decisions
Which Types of Schools Are the Most Selective for Statistics Applicants?
Admissions competitiveness for statistics programs varies considerably across institutional types, influenced by factors like enrollment capacity, applicant demand, and reputational standing within quantitative fields. Schools with extensive research funding and large doctoral offerings often attract more applicants than they can admit, elevating selectivity. Conversely, institutions with broader missions or fewer resources usually have more flexible admissions targeted at diverse student populations. Understanding these dynamics helps clarify why selectivity patterns shift across the higher education landscape for statistics.
- R1 Research Universities: These institutions typically exhibit the highest selectivity for statistics applicants, driven by limited program slots and robust national or international applicant pools. Their established quantitative research reputation encourages competitive GPAs and test scores, with admission rates often below 15%. The prestige of these universities is coupled with resource-intensive training and faculty-led research opportunities that also heighten enrollment demand.
- Liberal Arts Colleges: While offering statistics programs with a broader interdisciplinary focus, liberal arts colleges maintain moderate selectivity. Limited capacity combined with a smaller applicant volume means admission is less competitive than at R1 universities, but still selective enough to ensure prepared students. These colleges prioritize adaptability and cross-disciplinary skills, leading to somewhat different admission standards focused less on narrow quantitative metrics.
- Regional Public Universities: These institutions frequently display higher acceptance rates for statistics majors, reflecting broader enrollment goals and regional service mandates. Admission criteria tend to be more flexible, accommodating a wider range of academic backgrounds. Their programs often emphasize applied learning and accessibility, which corresponds to less intense competition compared to research-intensive peers.
- Graduate Programs at Top Research Schools: Doctoral and master's level statistics programs at leading research institutions typically require undergraduate GPAs above 3.7 and high GRE quantitative scores, where used. Though many programs have adjusted testing policies post-pandemic, underlying expectations around academic rigor and quantitative aptitude sustain competitive admissions. Such selectivity underscores prioritization of applicants prepared for advanced methodological training and research commitments.
How Do Admissions Standards Differ Across States and Regions?
Admissions standards for statistics degree programs in the United States display clear variation across different states and regions, influenced by an interplay of institutional goals and external factors. Data from 2024 by the National Center for Education Statistics and various state university systems reveal that institutions in regions like the Northeast and West typically impose higher GPA requirements and maintain stricter admissions criteria compared to those in the South and Midwest. These selective programs often retain standardized testing requirements or apply them selectively, reflecting an emphasis on academic rigor and preparedness. Conversely, many programs in the South and Midwest adopt more flexible standards, including widespread test-optional policies, prioritizing broader access and accommodating diverse student bodies.
The underlying causes of this divergence connect deeply to regional differences in public funding, workforce demand, and demographic trends. States with robust funding for higher education and concentrated urban populations invest more in competitive, resource-intensive programs aligned with labor markets that value analytical precision, such as those in technology hubs and finance centers. Meanwhile, regions with expanding healthcare and manufacturing sectors or more rural populations lean toward inclusive admissions models designed to meet growing demand for data-literate graduates while balancing institutional capacity constraints. Institutional selectivity often correlates with these economic and policy environments, with education systems in densely populated or high-cost areas enforcing higher entry thresholds and those in less densely populated areas emphasizing flexible pathways to build skills in situ.
A statistics graduate from a Midwestern public university recounted the uncertainty experienced during her application cycle, where rolling admissions deadlines and inconsistent notification times made it challenging to decide whether to wait for selective programs or commit to the more accessible local option. She recalled preparing intensely for standardized exams despite many programs being test-optional, feeling the pressure to present the strongest possible profile as admissions policies continued to shift. This experience highlighted the nuanced decision-making required by applicants navigating varied regional admissions landscapes, balancing the desire for prestige against practical timelines and regional workforce alignment.
How Do Admissions Requirements Compare Between Online and Campus Programs?
Admissions requirements for campus-based and online statistics programs diverge notably in response to differing institutional priorities and student profiles, as reflected in 2024 data from multiple higher education sources. Campus programs usually maintain higher GPA thresholds, typically around 3.3 to 3.5, consistent with traditional selectivity norms and expectations of in-person academic rigor. In contrast, online programs tend to be more flexible, often accepting students with GPAs closer to 3.0, recognizing the variety in educational backgrounds and the prevalence of working adult learners. Additionally, standardized testing policies differ; while campus programs may still request GRE scores as a differentiating factor in competitive applicant pools, online programs frequently waive such requirements, emphasizing professional experience and prior quantitative coursework instead. These variations shape acceptance rates and GPA expectations for online statistics degrees, reflecting a broader shift in graduate admissions practices.
The factors driving these contrasts include the need for accessibility and scalability in online offerings, which target career-focused learners balancing employment with education. Campus programs, conversely, aim to attract traditional students seeking immersive academic engagement, warranting stricter academic standards and holistic evaluation elements such as research experience and letters of recommendation. This divergence also reflects differences in academic support structures and institutional commitment to maintaining campus-based intellectual community standards. These operational distinctions influence not only admissions policies but also the design of curricula and student success mechanisms, underscoring that program delivery models fundamentally shape enrollment accessibility and criteria.
Understanding these admission differences aids prospective students and advisors in navigating enrollment decisions, especially as employers increasingly assess credentials beyond degree modality, focusing on demonstrated skills and experience. These dynamics interact with broader enrollment trends, influencing perceptions of program rigor and practical value. For those seeking accelerated options, exploring a fastest online master's degree may provide tailored pathways aligned with specific career timelines and learning preferences.
Is There a Relationship Between Admissions Standards and Student Success?
Recent data from the National Center for Education Statistics indicates that higher admissions standards in statistics degree programs, often marked by elevated GPA requirements and standardized testing, correlate with improved retention and graduation rates; programs admitting students with an incoming average GPA above 3.5 showed roughly 20% higher retention. Nonetheless, the link between admissions rigidity and student success is complex and not uniform across all outcome measures. Research from 2024 also highlights that robust academic support systems and institutional resources are critical mediators in translating admissions selectivity into measurable student achievement. This nuance aligns with evidence emphasizing that statistics student debt repayment success factors are not solely driven by admissions criteria but also by how effectively institutions prepare graduates for workforce integration.
Several factors complicate the straightforward association between selectivity and success. Variability in student demographics, access to tailored academic advising, and program design differences-in particular the inclusion of experiential learning or internships-significantly influence outcomes. Institutions with more moderate or flexible admissions policies often supplement these with stronger applied project opportunities, allowing students to develop competencies valued by employers beyond academic credentials alone. This suggests that narrow focus on admissions standards overlooks how institutional funding and graduation requirements shape the broader environment that supports or hinders student progress. Such factors are especially relevant for transfer applicants and nontraditional students whose educational pathways may not align with conventional selectivity markers.
For prospective students and advisors weighing program quality, admissions selectivity should not be viewed as a sole proxy for educational effectiveness or long-term career outcomes. Employers increasingly prioritize practical data analysis skills and problem-solving ability, sometimes placing equal or greater weight on relevant experience than on single admissions metrics. Recognizing these tradeoffs is essential when navigating options, including decisions about funding education pathways or comparing degrees such as a master's degree in marketing with statistics programs. Careful evaluation of how admissions policies interact with institutional supports and real-world applicability offers a more reliable framework for assessing graduate success in the evolving labor market.
How Can Students Strengthen a Statistics Program Application?
Strengthening an application to a statistics program requires more than meeting baseline criteria; it involves demonstrating academic rigor, relevant experience, and a clear understanding of how one's goals align with the program's focus. Admissions committees assess an applicant's readiness by looking for evidence of both quantitative competence and applied skills that indicate the potential for success in advanced statistics coursework and research. Strategic presentation of these elements signals fit, motivation, and long-term potential in a field where employers increasingly value practical data skills alongside theoretical knowledge.
- Academic Performance in Quantitative Courses: Admissions officers prioritize strong grades in core mathematics and statistics courses, especially calculus and linear algebra. A GPA above 3.5 in these subjects often reflects the analytical foundation necessary to handle rigorous curriculum demands and predicts student persistence in competitive programs.
- Relevant Practical Experience: Engagement in internships, research projects, or analytical roles demonstrates applied competency. Committees interpret this as a sign that candidates grasp real-world data challenges, enhancing their preparedness beyond classroom theory and aligning with workforce expectations.
- Articulated Purpose and Career Goals: A well-developed statement of purpose that clearly links personal interests to the program's strengths signals intentionality and focus. This contextualizes academic and experiential components within a coherent narrative, which is crucial in holistic review processes.
- Programming and Data Tool Proficiency: Demonstrating skills in languages like R or Python and data visualization tools distinguishes applicants by showing readiness for contemporary statistical workflows. Committees view this as evidence of adaptability and practical skill sets that complement theoretical learning.
- Strong Letters of Recommendation: Recommendations from faculty or industry professionals familiar with quantitative aptitude provide credible validation of analytical abilities and work ethic. These endorsements often carry weight in differentiating applicants with similar academic profiles.
References:
- Demystifying Graduate Admissions for Statistics PhD Programs https://raybai.net/demystifying-graduate-admissions-for-statistics-phd-programs
- Student Loan Debt Statistics [2026]: Average + Total Debt https://educationdata.org/student-loan-debt-statistics
- The Impact of Student Loan Debt https://www.nar.realtor/research-and-statistics/research-reports/the-impact-of-student-loan-debt
- List of Colleges Dropping & Reinstating ACT/SAT Requirements https://progresslearning.com/news-blog/colleges-dropping-reinstating-act-sat-requirements/
- Selective Schools Admissions Stats - Top Tier Admissions https://toptieradmissions.com/selective-schools-admissions-stats/
- Why it’s Important to Use University Acceptance Rates and GPA/Test Scores When Building a College List: A Guide for International Students https://www.collegeessayguy.com/blog/college-list-acceptance-rates-gpa-international-students
- 5 High School Classes Highly Selective Colleges Expect You to Take https://www.saraharberson.com/blog/high-school-classes-highly-selective-colleges-expect-you-to-take
- View of Test-Optional Policies: Impacts to Date and Recommendations for Equity in Admissions https://journals.flvc.org/jpss/article/view/135721/141718
- Trump's Executive Order on College Admissions Data Explained https://jamessmurphy.com/2025/08/08/making-sense-of-the-changes-coming-to-higher-ed-admissions-data-collection/
- Graduate School Acceptance Rates: Can You Get In? • PrepScholar GRE https://www.prepscholar.com/gre/blog/graduate-school-acceptance-rates/
Other Things You Should Know About Statistics
Higher GPA expectations often correlate with more rigorous coursework and deeper quantitative training, which can better prepare students for the analytical demands of statistics careers. However, a strong GPA from a less challenging curriculum may undervalue actual readiness for complex statistical problem-solving. Applicants should prioritize programs where GPA standards reflect substantive content and practical skills rather than superficial grade inflation, as this alignment better signals employability in data-intensive roles.
While removing standardized test requirements may increase access, it also shifts emphasis onto coursework, projects, and letters of recommendation that demonstrate technical competence. For applicants in statistics, where quantitative aptitude and analytical reasoning are critical, showcasing tangible skills through prior math or computer science courses can outweigh the absence of test scores. Prospective students should focus on building demonstrable technical evidence in their applications to differentiate themselves effectively.
Choosing programs with higher acceptance rates can offer access to statistics education but often implies less competitive environments and potentially fewer research or internship opportunities. Applicants with borderline GPAs should assess whether these programs provide sufficient depth and applied learning to meet employer expectations in analytics or data science roles. Prioritizing program quality and outcomes over selectivity may yield better long-term career benefits than relying solely on acceptance ease.
Admissions shifts favoring broader evaluation criteria indicate recognition that statistics professionals need diverse skills beyond test scores, such as data communication and programming. However, this evolution requires applicants to adapt by emphasizing practical experience and interdisciplinary abilities rather than traditional academic metrics alone. Understanding these dynamics helps students align their preparation and applications with the increasingly multifaceted demands of statistics-related employment.