2027 Evaluating Overdispersion in Surveillance Count Data for MPH and MS Students

Co-Founder and Chief Data Scientist
A Poisson model can make a surveillance trend look more certain than it is when case counts vary more than the model expects. For MPH and MS students analyzing reports across places or weeks, recognizing that extra variation is essential to defensible estimates and useful public health decisions. This guide explains how to diagnose overdispersion, compare modeling options, and distinguish a statistical problem from changes in reporting or population size. It also shows what training and program features matter if surveillance analysis is part of your career goal.
Key Things You Should Know
- In a Poisson model, the conditional variance equals the conditional mean; a variance-to-mean ratio above 1 is a warning, not a diagnosis, because populations and reporting conditions may differ.
- Check residual variation after accounting for population size, time, geography, and reporting patterns; a Pearson dispersion estimate substantially above 1 can indicate that Poisson uncertainty is understated.
- Negative binomial models address one common form of extra variation, but reporting delays, correlated observations, and excess zeros may require different solutions.
What is overdispersion in public health surveillance count data?
Overdispersion means observed counts vary more than a specified probability model predicts. For a Poisson model, the variance is assumed to equal the mean conditional on the model's predictors. The relevant question is therefore not simply whether the raw variance exceeds the raw mean. It is whether variation remains unusually large after accounting for factors such as population at risk, season, location, and reporting practices.
Suppose a student models weekly reported cases by county. Different county populations create different expected counts, so the model may need a population offset. Changes in testing or delayed reports can also produce spikes. Even with an offset and suitable predictors, unmeasured differences between counties may leave more variation than a Poisson model allows. These explanations have different remedies; overdispersion is a diagnostic finding, not a disease characteristic.
Students building their statistical foundation through accelerated online coursework for public health undergraduates should prioritize probability, regression, and data interpretation before attempting advanced surveillance models.
Why does overdispersion matter for MPH and MS public health analyses?
If a Poisson model understates variability, its standard errors and confidence intervals may be too small. An association with a policy period or neighborhood characteristic could then appear more precise than the data justify. Overdispersion also affects predictions: a model that expects relatively stable counts may fail to represent the range surveillance teams actually see.
The consequences depend on the decision. An analyst describing historical patterns needs appropriately qualified uncertainty; a team using predictions to plan staffing needs to know whether unusually high counts are plausible. Neither use makes a regression coefficient causal. Changes in who gets tested, whose reports arrive on time, or which populations are captured can bias surveillance findings even when the variance model fits well.
This distinction matters at every education level. An undergraduate exploring low-cost public health bachelor's programs online may first learn to identify unstable rates; graduate-level analysis adds responsibility for model diagnostics and interpretation.
Which statistical models evaluate overdispersion in surveillance data?
Begin with the data-generating process, then compare models. The table summarizes what common options address and what they leave unresolved; none substitutes for checking how cases were counted and reported.
| Approach | When it may fit | Important limitation |
| Poisson regression | Conditional count variation is reasonably consistent with the Poisson assumption. | Unexplained extra variation can understate uncertainty. |
| Quasi-Poisson regression | The mean model is useful, but standard errors need a dispersion adjustment. | It does not specify a full probability distribution for likelihood-based comparisons. |
| Negative binomial regression | Counts show extra variation consistent with the model's variance structure. | It does not automatically correct temporal dependence or reporting bias. |
| Poisson model with robust standard errors | The mean model is credible and the principal concern is inference. | It does not improve the model's count predictions; the standard errors must match the clustering structure. |
| Mixed-effects or time-series count model | Repeated observations share county-level or time-dependent variation. | Its assumptions and additional parameters need enough data to assess. |
For a fitted Poisson model, students can calculate the sum of squared Pearson residuals divided by the residual degrees of freedom. A value well above 1 suggests excess variation, but it is not a universal cutoff or a substitute for residual plots. With sparse counts, few independent units, or correlated observations, that summary can mislead.
A defensible workflow separates diagnosis from model choice:
- Define the case count, reporting interval, population at risk, and intended comparison; use an exposure offset when appropriate.
- Inspect counts, missing reports, zeros, outliers, and changes in case definitions or testing.
- Fit a plausible baseline model and examine residuals by time, place, and fitted count.
- Assess dispersion and dependence, then compare alternatives using diagnostics and the decision the model must support.
- Report sensitivity analyses and explain what uncertainty the chosen model does not capture.
Excess zeros deserve particular caution: they might reflect genuinely low incidence, small populations, or absent reporting. A zero-inflated model is appropriate only when its proposed zero-generating process is credible. Students aiming to develop new count-model methods, rather than apply established ones, can examine cost-conscious public health PhD planning after establishing whether doctoral research is necessary for that goal.
An MPH commonly connects epidemiology and biostatistics to population-health practice: defining surveillance measures, assessing data quality, communicating uncertainty, and informing agency decisions. A research-oriented MS may devote more time to probability, statistical inference, advanced regression, and a thesis or supervised research. These are tendencies, not guarantees about a particular curriculum.
For this topic, inspect course descriptions for generalized linear models, count outcomes, longitudinal or spatial data, and model diagnostics. Ask whether students analyze imperfect reporting data under supervision, rather than only clean classroom examples. An applied MPH project and an MS thesis can both be valuable, but their requirements and opportunities for original methods work differ by program.
Admissions accessibility is a separate question from technical depth. When considering online MPH programs with accessible admissions, confirm that you can take the mathematics and advanced analysis courses needed for your intended work.
Students need more than the ability to run a regression command. They should be able to define a consistent case, choose an appropriate denominator, reconcile missing or delayed reports, and explain how aggregation changes the question. Statistical preparation should include probability, regression, offsets, residual diagnostics, correlated data, and interpretation of uncertainty.
Reproducible work matters just as much: document case definitions, data-cleaning decisions, software versions, model specifications, and sensitivity checks. For restricted surveillance records, confirm data-use permissions, privacy safeguards, and any required institutional review before accessing or sharing data. A portfolio can demonstrate methods with public or appropriately authorized data without revealing confidential records.
If your goal is advanced methodological research, compare the supervised research and funding available beyond a master's degree with public health doctoral program cost-benefit considerations. If your goal is competent applied analysis, targeted methods coursework and supervised projects may be more direct.
Choose according to the work you want to perform, not the degree initials alone. An MPH may fit an analyst who wants to translate surveillance findings into public health action and work with program or agency partners. An MS may fit a student seeking deeper statistical theory, sustained faculty research, or preparation for methods-focused doctoral study. Either can be a poor fit if its actual courses stop before count regression.
Compare required mathematics, the availability of advanced electives, access to an advisor who works with surveillance data, and whether the culminating experience permits a substantial analysis. Account for tuition, fees, time away from work, and any unpaid project obligations using each school's published terms. For a wider explanation of types of public health master's degrees, keep the surveillance role you want as your comparison point.
Both formats can teach count models and reproducible coding. What differs is how readily students can obtain feedback, collaborate on research, and work with an authorized surveillance partner. Ask whether advanced courses run regularly, whether office hours accommodate your schedule, and whether remote students can join supervised projects. Online delivery does not guarantee asynchronous classes or remote field placements.
Compare the full cost and feasibility of affordable online graduate MPH pathways, including required visits, software, project time, and the availability of suitable local or remote data work. A less expensive format is only useful if it supports the technical practice and supervision you need.
Check institutional accreditation and public health-specific accreditation separately. The Council on Education for Public Health (CEPH) accredits eligible public health schools and programs; verify the accredited entity, its current status, and whether the degree you are considering falls within its scope. Do not infer that an MS is covered simply because an institution also offers a CEPH-accredited MPH.
For CEPH accreditation for online MPH study, confirm the precise program and entry-term details with the school and accreditor. Accreditation is an important quality check, but it does not establish that advanced surveillance modeling is taught.
Relevant roles include public health data analyst, surveillance analyst, epidemiologist, and biostatistician. Their tasks differ: an analyst may clean and summarize reports, an epidemiologist may investigate population patterns, and a biostatistician may design or evaluate more complex analyses. Job titles and degree requirements vary by employer; classroom exposure to negative binomial regression alone does not establish readiness for independent specialist work.
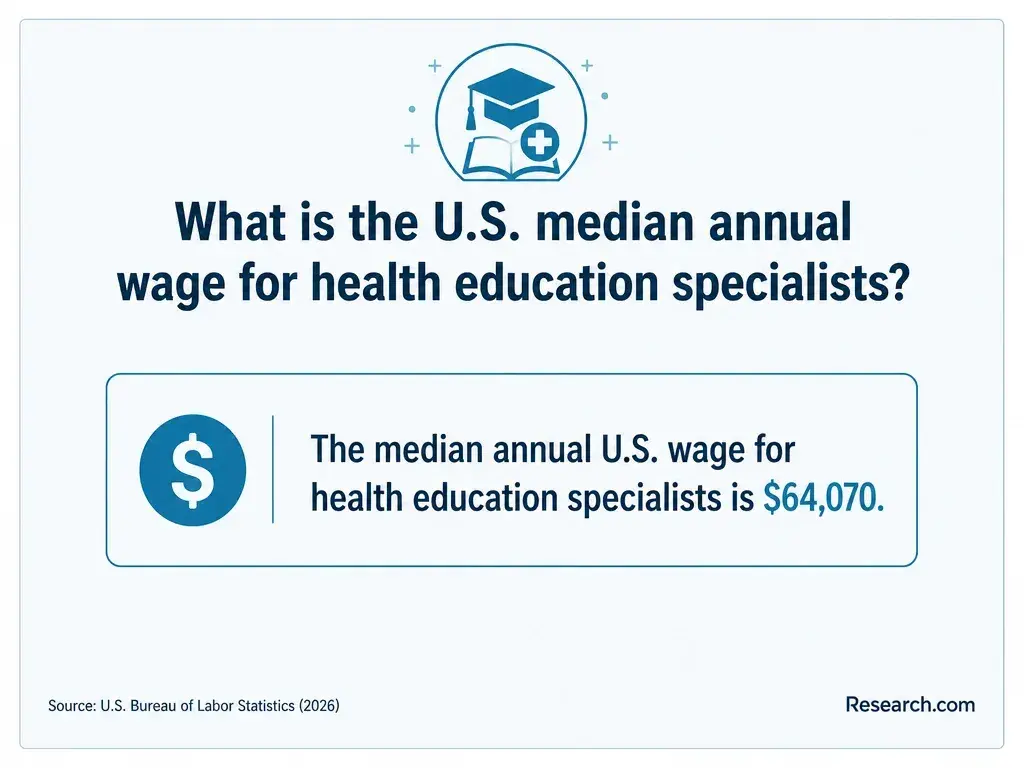
For pay, use a current US Bureau of Labor Statistics occupation and location that match the job's actual duties, then compare specific postings. An occupation-wide median is neither a starting offer nor an outcome for graduates of a particular MPH or MS. MPH career pay comparisons can provide context, but supervised analysis, software proficiency, and public health experience remain important evidence for hiring.
How can you compare public health programs for surveillance data expertise?
Request recent syllabi and a sample degree plan. Then ask an instructor or advisor whether students fit and critique count models using data with realistic missingness, reporting changes, and repeated observations. Confirm who supervises projects, what data students can actually access, and whether the culminating work can demonstrate reproducible analysis.
Match those answers to your starting preparation. A student who needs foundational regression may benefit more from a strong sequence of accessible courses than from an advanced elective with unmet prerequisites. A student planning original methods research should investigate advisor fit and research access before considering public health doctorate admissions flexibility; easier entry does not resolve those research requirements.
The best next step is to obtain comparable course, project, schedule, and cost information from each shortlisted program. Favor the option that lets you demonstrate sound diagnosis, model choice, and honest interpretation - not merely name a model on a résumé.
Other Things You Should Know About Public Health
You can calculate a descriptive variance-to-mean ratio if the underlying counts are available, but a dashboard summary usually cannot support a model-based diagnosis without information about populations, time periods, and reporting.
No. It indicates evidence under that model's assumptions. If dispersion or dependence is mishandled, reassess the uncertainty before relying on the result.
No. Suppression means the count was withheld, not necessarily that no cases occurred. Follow the data provider's rules and use an analysis that respects the missing information.
Only after checking the applicable data-use agreement, agency permission, privacy requirements, and institutional review process. Permission to analyze data for coursework does not automatically permit publication.
- Guidelines for Evaluating Surveillance Systems | cdc.gov https://www.cdc.gov/mmwr/preview/mmwrhtml/00001769.htm
- A modelling approach for correcting reporting delays in... - PMC https://pmc.ncbi.nlm.nih.gov/articles/PMC6900153/
- Quasi-Poisson vs. negative binomial regression | nih.gov https://pubmed.ncbi.nlm.nih.gov/18051645/
- Count Data Regression Analysis | umass.edu https://openpublishing.library.umass.edu/pare/article/1569/galley/1520/view/
- 12.3 - Poisson Regression | STAT 462 - Statistics Online https://online.stat.psu.edu/stat462/node/209/
- Scale adjustment versus modeling | sagepub.com https://journals.sagepub.com/doi/10.1177/0962280215588569
- Negative Binomial vs Quasi-Poisson | MetricGate https://metricgate.com/blogs/negbin-vs-quasi-poisson-overdispersion/
- A Flexible Mixed Model for Clustered Count Data | mdpi.com https://www.mdpi.com/2571-905X/5/1/4
- Models for Count Data with Overdispersion | github.io https://grodri.github.io/glms/notes/overdispersion
- Do We Really Need Zero-Inflated Models? | Statistical Horizons https://statisticalhorizons.com/zero-inflated-models/