2027 Building an Outreach Attendance Tracker With Synthetic Data

Co-Founder and Chief Data Scientist
An outreach attendance tracker can help a community program see which events reached people and where follow-up may be needed. For a student, building one with synthetic data offers a way to practice that work without requesting access to participant records. This guide shows how to define attendance, structure a small dataset, check calculations, and explain the tool's limits. It also helps you decide whether the project fits a course or portfolio - and whether further public health training would add value.
Key Things You Should Know
- Start with the decision the tracker serves: session turnout, repeat participation, or follow-up. Each needs a different count or data structure.
- Use invented records and label every demonstration result as illustrative. For example, 18 attendees out of 24 registrants would be 75% attendance in a hypothetical session - not evidence about a real program.
- A strong student deliverable includes a data dictionary, documented calculations, data-quality checks, privacy limits, and a short explanation of what attendance cannot measure.
What is an outreach attendance tracker with synthetic data?
An outreach attendance tracker is a spreadsheet, database, or simple dashboard that records planned community outreach sessions and participation. Its audience might be a health educator checking turnout, a nonprofit coordinator planning staffing, or an evaluator preparing a process report. Synthetic data are invented records designed to resemble the structure of a possible dataset; they are not observations from actual participants.
The first design choice is the unit of a record. One row per session supports event-level counts without any participant identifiers. One row per attendance instance - one person at one session - can demonstrate repeat visits, but requires a consistent invented person ID. Neither structure, by itself, shows whether someone learned from an event or changed a health behavior.
These measures answer different questions, so a dashboard should name its denominator rather than display an unexplained "attendance rate."
| Measure | What it counts | Important limitation |
| Registrations | People signed up for a session | Not everyone registered attends |
| Visits | Attendance instances across sessions | A returning person can be counted more than once |
| Unique attendees | Distinct people within a defined period | Requires a consistent person ID and a stated time window |
For an introductory project, a session-level tracker is often enough. A student taking intensive online public health bachelor's classes could keep the scope to session counts and a documented summary rather than build unnecessary participant-level features.
How can public health students build an outreach attendance tracker?
Build the tracker backward from a decision, such as whether turnout differed across session times. A spreadsheet is sufficient for a small class exercise; use a database or scripted workflow only if the learning objective calls for one. The following sequence produces an adaptable template, not a completed evaluation of a real organization.
- Write the question and scope. Specify the intended user, reporting period, types of outreach sessions, and whether the tool counts sessions, visits, or unique people.
- Define fields. For a session-level sheet, consider session ID, date, location category, topic, planned capacity, registrations, attendees, and data-entry status. Define each field's allowed values in a data dictionary.
- Create clearly invented records. Use fictional session IDs and plausible values; do not copy a partner's actual schedule, participant characteristics, or small-cell patterns and merely change names.
- Build checks and calculations. Flag duplicate session IDs, impossible dates, missing counts, and attendance above capacity for review. Calculate a registration-to-attendance rate only where registrations exist and explain how walk-ins are handled.
- Test the output. Recalculate a few rows by hand, document whether canceled sessions are excluded, and ask a classmate or supervisor whether the labels are understandable.
- Package the deliverable. Include the blank template, synthetic sample, data dictionary, calculation notes, quality checks, and a brief limitations statement.
For example, hypothetical counts of 18 attendees and 24 registrants yield 18 ÷ 24 = 75%. That figure describes only the invented example. If walk-ins are included among attendees but not registrants, the ratio needs a different label or denominator; it should not be presented as a conventional attendance rate without explanation.
A project can demonstrate preparation for further study, but it does not waive admissions conditions. Students exploring public health master's conditional admission options should verify outstanding requirements with each program separately.
Why use synthetic data for public health outreach analysis?
Synthetic records let students test a tracker's layout, formulas, and explanations without obtaining access to identifiable attendance lists. That is useful when a course project does not require a community partner or when an organization cannot authorize use of its records. Invented data also make it possible to test edge cases deliberately, such as a canceled session, missing registration count, or duplicate ID.
They are not a privacy guarantee for data derived from real people. Calling a dataset synthetic does not make it safe if its rows closely reproduce sensitive source records or recognizable combinations. For coursework, generating records independently is simpler. If a project later uses actual outreach data, check the organization's permissions, data-use rules, storage requirements, and any institutional review or community approval that applies before receiving or publishing anything.
Synthetic data can validate whether a formula works; they cannot establish actual turnout, disparities in reach, program effectiveness, or community preferences. In a portfolio, label screenshots and charts "synthetic demonstration" and describe what would require real, authorized evidence. This can show practical readiness to applicants considering public health master's options after a weak GPA, without implying that a portfolio replaces academic requirements.
Courses in program planning or evaluation are the closest fit when the goal is to choose indicators and explain what attendance reveals about implementation. Introductory biostatistics or data-management courses can strengthen spreadsheet checks, denominators, and reproducible summaries. Community health and health communication courses add context: a low count may reflect scheduling, transportation, language access, or outreach methods rather than lack of interest.
Look at assignments, not course titles alone. For this tracker, useful evidence includes building a data dictionary, cleaning records, defining a process measure, and presenting results to a nontechnical audience. An MPH may offer applied program-evaluation opportunities; a research-oriented MS may emphasize more intensive analysis. Neither degree is necessary to create a basic tracker. A short spreadsheet or evaluation course plus supervised feedback may be the better investment if that is the only skill you need.
Students weighing broader graduate study should compare the full cost with the training they will actually use. Information on public health master's tuition after university aid is relevant to that decision, but any award and its eligibility conditions must be confirmed with the school.
The essential skills are less about advanced software than about defining and checking a measure. An analyst should distinguish registrations from visits and unique people, calculate totals consistently, document missing or canceled sessions, and communicate results without claiming that attendance proves an event improved health.
Interpretation matters as much as arithmetic. Comparing turnout by location or time may help staff plan future sessions, but a difference is not automatically caused by that location or time: promotion, weather, capacity, and who was able to attend may also vary. Small groups and incomplete sign-in sheets further limit conclusions. If demographic fields are proposed, first establish why they are needed, whether collection is appropriate, and who may access the results.
A student can demonstrate these skills with a versioned spreadsheet, a short methods note, and a plain-language summary reviewed by an instructor or supervisor. More advanced epidemiologic research requires additional design, statistical, and governance skills. Someone considering that route should compare training and funding - including epidemiology doctoral tuition support - against a research goal, not treat a doctorate as a requirement for attendance reporting.
Either format can support a tracker project. The deciding factor is whether you can get feedback on data definitions, ethical use, and communication - not whether the spreadsheet is built in a classroom. Online study may reduce travel, while campus study may make scheduled collaboration easier; neither automatically provides a community partner or access to real records.
The comparison below focuses on the parts of delivery that can affect this particular project. Confirm the actual schedule and project rules with any program you consider.
| Consideration | Online program | Campus program |
| Feedback | May use remote office hours and shared files | May offer in-person workshops and meetings |
| Schedule | May still require live classes or group meetings | May require travel at fixed times |
| Applied work | May permit a remote project, subject to approval | May have local partner opportunities, subject to availability |
Before enrolling, ask whether a synthetic-data deliverable meets the specific course or capstone requirement; some applied experiences require an approved practice site. Students comparing affordable online graduate MPH pathways should also check required live sessions, fieldwork, total charges, and available supervision rather than judge fit by tuition alone.
If you want academic credit for this project, first confirm that the institution has recognized institutional accreditation and that the course belongs to the degree you intend to pursue. For a public health degree, check the Council on Education for Public Health (CEPH) directory for the exact accredited school, unit, or program and whether the degree under consideration falls within its scope. Institutional accreditation and CEPH accreditation answer different questions; neither confirms that a particular class will accept your proposed tracker.
Ask the program to identify the course or applied-project policy governing synthetic datasets, faculty approval, and assessment. If you are considering doctoral study, accreditation should be checked alongside research fit and requirements; a public health doctoral program selectivity overview is not a substitute for confirming accreditation scope or project supervision.
You do not need admission to a public health degree to make a synthetic attendance tracker. For credit-bearing work, however, you must meet the institution's admission and course-enrollment rules. Bachelor's programs, professional MPH programs, and research-oriented MS programs can differ in prerequisites and expectations; check the specific program rather than assuming public health experience or a statistics course is universally required.
If the tracker is intended as an application portfolio piece, explain your own contribution, show the data dictionary and checks, and clearly state that the records are invented. It may demonstrate initiative, but it does not establish field experience or satisfy a formal prerequisite. Applicants seeking public health graduate admissions with fewer reference documents should confirm each school's current requirements directly; a project cannot replace a required reference.
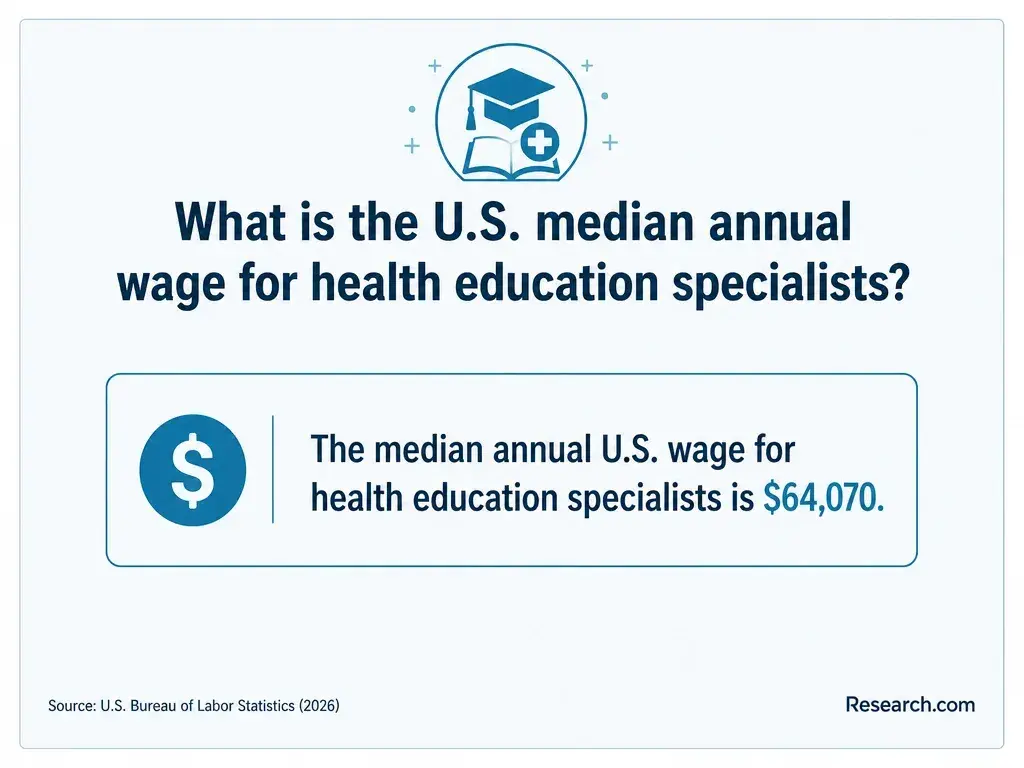
Community health workers and outreach coordinators may record participation and identify people who need follow-up. Health education specialists may use session counts alongside feedback to adjust programming. Program assistants and evaluation staff may check data quality, summarize reach for managers or funders, and explain reporting limitations. The level of responsibility depends on the employer, experience, and any applicable job-specific requirements - not on possession of a tracker template.
For an early-career applicant, a synthetic tracker is most persuasive when paired with supervised experience communicating with communities or supporting a real program. Keep those claims separate: a portfolio can show how you would organize data, while a supervisor can speak to how you worked with people and followed site procedures. If an MPH is under consideration, compare budget-conscious MPH study and career outcomes with the actual qualifications in target job postings. A degree may be valuable for broader evaluation responsibilities, but it is not the automatic next step for an entry-level reporting task.
What salaries and job outlook apply to public health data careers?
There is no reliable salary or growth figure for "outreach attendance tracker builder" because it is a task, not a defined occupation. For US comparisons, use the Bureau of Labor Statistics Occupational Outlook Handbook entry that matches the job's principal duties - such as community health worker, health education specialist, or epidemiologist - and check its wage reference year, projection period, education description, and work setting. An epidemiologist's occupation-wide median, for example, should not be presented as the expected pay for a new outreach assistant.
Pay and opportunity also vary by employer, region, experience, and scope of work. Use career salary ranges for MPH degree holders as context, then compare current local postings for the specific role you want. A useful next decision is whether those postings ask for a degree, demonstrated evaluation skills, community experience, or a combination - and whether a short supervised project would close the gap more directly than further formal study.
Other Things You Should Know About Public Health
Yes, if you created the content and it contains only independently invented records. Include a visible synthetic-data label and remove any confidential organization materials or identifying file metadata before sharing.
Use a spreadsheet if it can meet your course objectives and you can explain its formulas. Move to a database or code when the assignment or scale calls for it, not simply to make the project look more advanced.
Only if the project's purpose requires one. For a synthetic exercise, a mock form can illustrate how fields would be collected, but a real form needs site approval, an appropriate explanation to participants, and secure handling.
Ask an instructor or peer to follow your data dictionary, reproduce one calculation, and identify any confusing chart labels. That tests clarity without implying community endorsement.
- Reducing non-attendance in outpatient appointments - PMC https://pmc.ncbi.nlm.nih.gov/articles/PMC8985245/
- Using Technologies for Data Collection and Management | cdc.gov https://www.cdc.gov/field-epi-manual/php/chapters/data-collection-management.html
- Spreadsheets and Databases as Tools for Data Management | Research Data Services https://researchdata.wisc.edu/storing-data/databases/spreadsheets-and-databases-as-tools-for-data-management/
- Data Organization in Spreadsheets - Reproducible Research Methods - LibGuides at California State University Fresno https://guides.library.fresnostate.edu/reproducible/spreadsheets
- Appendix B: Synthetic population dataset | Pew Research Center https://www.pewresearch.org/methods/2018/01/26/appendix-b-synthetic-population-dataset/
- Everything You Need To Know About Synthetic Datasets | LimeSurvey https://www.limesurvey.org/blog/knowledge/everything-you-need-to-know-about-synthetic-datasets
- Chapter 5: Collecting data | Cochrane https://www.cochrane.org/authors/handbooks-and-manuals/handbook/current/chapter-05
- Nonprofit Data Collection: Plan Evidence Your Team Can Use | Sopact https://www.sopact.com/use-case/nonprofit-data-collection
- Can Synthetic Data Replace Real Participant Data in Research? | Manuel B. Garcia https://manuelgarcia.info/guides/research/guide/synthetic-data-replace-real-participant-data
- A Systematic Review of Synthetic Data Generation Techniques Using Generative AI | mdpi.com https://www.mdpi.com/2079-9292/13/17/3509