2027 College Application Statistics: Applications, Acceptance and Enrollment Trends

Co-Founder and Chief Data Scientist
Student recruitment teams are competing in a market where applications are rising faster than enrollments at many institutions. Common App reported more than 1.3 million first-year applicants during the 2023-24 cycle, while National Student Clearinghouse data showed uneven enrollment recovery across sectors.
This article explains what current college application, acceptance, and enrollment trends mean for universities, online programs, bootcamps, and agencies. You will learn where demand is growing, why admitted students fail to enroll, and how to build marketing systems that attract higher-intent prospects instead of simply generating more leads.
Key Things You Should Know
- Application volume is concentrated, large public universities, selective private institutions, and recognizable online or career-focused brands receive outsized demand, while many regional and smaller institutions must work harder to create awareness and trust.
- Acceptance rate alone is not enough to judge recruitment health, yield, inquiry quality, affordability, program fit, and speed of follow-up determine whether applicants become enrolled students.
- College Board's 2024 pricing data shows published tuition and fees reached $11,610 for in-state public four-year colleges and $43,350 for private nonprofit four-year colleges, making cost clarity a central conversion factor.
How many students apply to college each year?
Each year, millions of students apply to U.S. colleges, but there is no single national application count that captures every application because students often apply to multiple institutions and because two-year, graduate, online, certificate, and non-degree pathways use different admissions systems. The best way to understand application demand is to separate applicants from applications: one student may submit one application or ten.
Common App is one of the clearest indicators of application behavior among four-year institutions. Its 2023-24 cycle showed continued growth in first-year applicants and submitted applications, especially among students applying to multiple schools. For enrollment marketers, the important takeaway is that rising application volume does not automatically mean stronger intent. It often means students are comparison-shopping more aggressively.
The practical implication is that colleges should not treat every application source equally. A student who applies after reading program outcomes, cost details, accreditation information, and career fit content is usually different from a student who submits a low-effort form through a broad campaign. This is why recruitment teams should track not only application count, but also application source, program match, financial readiness, and post-acceptance engagement.
The table below summarizes the main application categories education marketers should distinguish when evaluating demand. The goal is to help teams avoid mixing high-intent and low-intent activity into one misleading metric.
| Metric | What it measures | Why it matters for marketing |
| Prospective students | People researching programs, careers, costs, rankings, or admissions requirements | This is the top of the demand funnel and the best audience for SEO, content, partnerships, and awareness campaigns |
| Inquiries | People who request information, download a guide, chat, call, or submit a lead form | This shows interest, but quality varies widely by source and message |
| Applications | People who formally apply to a program or institution | This is a stronger signal than an inquiry, but still requires financial, academic, and personal fit |
| Admits | Applicants accepted by the institution | This reveals admissions selectivity and the size of the pool available for yield campaigns |
| Enrollments | Accepted or eligible students who register, deposit, or begin classes | This is the metric leadership usually cares about most because it connects marketing to revenue and mission outcomes |
For growth teams, the mistake is assuming that more applications always solve enrollment pressure. In many markets, the stronger move is to increase the percentage of applicants who are financially prepared, academically eligible, and convinced that the program fits their goal.
Millions of students apply to colleges each year, with application volumes influenced by demographics, economic conditions, and admissions trends. Institutions can use how to build a course landing page to create targeted pages that encourage prospective students to explore programs and complete their applications.
What are current college acceptance rates?
Current college acceptance rates vary sharply by institution type. Broad-access colleges and many regional universities admit most qualified applicants, while highly selective universities admit a small share because they receive far more applications than available seats. NACAC's recent admissions reporting continues to show that the average four-year institution is much less selective than the colleges that dominate headlines.
Acceptance rate is the share of applicants who are admitted. It is useful for understanding competitiveness, but it can be misleading if viewed alone. A lower acceptance rate may reflect brand strength, application growth, limited capacity, or strategic enrollment management. A higher acceptance rate may reflect an access mission, rolling admissions, regional service, or a program designed for working adults.
The table below shows how acceptance-rate patterns typically translate into marketing priorities. It is not a ranking of quality; it is a decision tool for matching recruitment strategy to market position.
| Institution profile | Typical acceptance-rate pattern | Marketing priority |
| Highly selective national universities | Low acceptance rates because demand greatly exceeds capacity | Protect yield, communicate fit, and reduce melt among admitted students |
| Large public flagships | Moderate to selective, often varying by residency and major | Segment messaging by program, geography, affordability, and career outcomes |
| Regional public universities | Often less selective than national flagships | Build local trust, explain value, and remove friction for first-generation and transfer students |
| Private nonprofit colleges | Wide range, from highly selective to broad-access | Differentiate experience, financial aid, outcomes, and student support |
| Online degree and adult-learning programs | Often designed around eligibility, readiness, and fit rather than scarcity | Focus on speed, clarity, transfer credit, cost, flexibility, and career relevance |
For marketers, the key is to align channel strategy with admissions reality. Highly selective institutions may need fewer raw leads and more persuasive admitted-student nurturing. Broad-access and online programs often need demand creation, fast response, transparent pricing, and proof that the program is worth the student's time and money.
How many students enroll after applying?
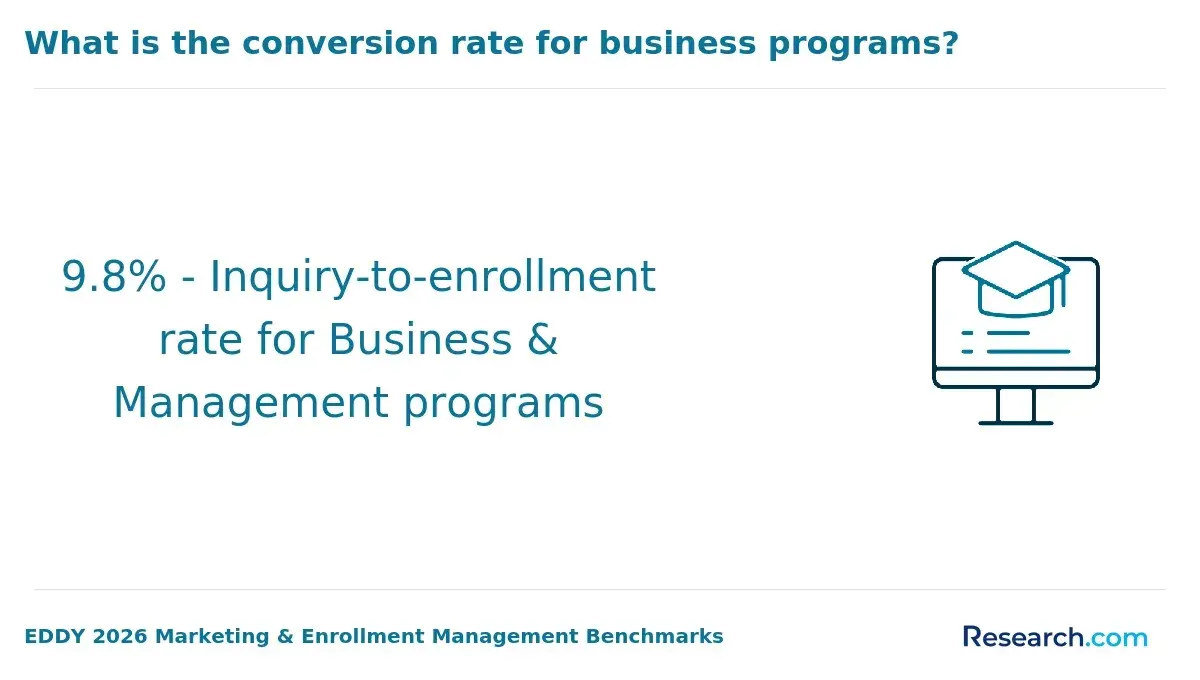
Enrollment after application depends on yield, which is the percentage of admitted students who actually enroll. Yield is one of the most important statistics for admissions and marketing teams because it shows whether the institution is attracting applicants who are likely to choose the school after acceptance.
Nationally, yield rates vary by selectivity, institution type, program format, financial aid, and student segment. A highly selective university may have a strong yield because admitted students see it as a top choice. A regional college may lose admitted students to lower-cost options, nearby competitors, family obligations, or uncertainty about career payoff. An online program may lose accepted students if the admissions process is slow or if tuition, transfer credit, and schedule expectations are unclear.
National Student Clearinghouse's 2024 enrollment updates showed recovery in undergraduate enrollment, but that recovery was not evenly distributed across all institutions. For marketers, this means that macro demand may be improving while individual programs still struggle if they are poorly differentiated or if their funnel leaks after acceptance.
A practical enrollment funnel should separate each conversion point. The following sequence helps teams diagnose where the real problem sits before they increase spending.
- Measure inquiry-to-application conversion by source, program, and student segment.
- Measure application completion, not just application starts, because incomplete applications often reveal friction or weak intent.
- Measure admit-to-enrollment yield by financial aid status, program, geography, and communication history.
- Measure melt after deposit or registration, especially among students who still need financing, documents, or employer approval.
- Compare enrolled-student quality by channel, including persistence, credit load, and first-term engagement when available.
If a campaign produces many inquiries but few applications, the issue may be audience quality or landing-page clarity. If applications are strong but yield is weak, the problem may be affordability, competitor positioning, slow follow-up, or insufficient nurturing after admission.
Which schools receive the most applications?
The schools that receive the most applications are usually large public universities, well-known national private universities, and institutions in popular locations or high-demand systems. University of California campuses, major state flagships, and selective private universities frequently appear near the top because they combine brand visibility, broad program portfolios, strong outcomes perception, and large applicant pools.
IPEDS and institutional admissions releases show that application volume is highly concentrated among recognizable brands. This matters for education marketers because students often begin with familiar names, then compare alternatives only if those alternatives appear credible, affordable, and relevant to their goals.
The table below highlights the types of institutions that typically receive very high application volume and what competing schools can learn from them. The purpose is not to copy their brand power, but to understand the demand signals they create.
| High-application institution type | Why students apply in large numbers | Lesson for competing programs |
| Large public university systems | Multiple campuses, broad academic choice, public visibility, and perceived value | Make program options easy to compare and emphasize cost, transfer paths, and outcomes |
| Selective private universities | Prestige, national reputation, alumni networks, and strong outcome perception | Compete with clarity, specialization, student support, and practical career alignment |
| Urban universities | Location, internships, employer access, and lifestyle appeal | Show how location or online flexibility connects directly to career opportunity |
| Online-first and adult-serving institutions | Flexible schedules, faster starts, transfer credit, and career-focused messaging | Remove uncertainty around time commitment, cost, credit transfer, and support |
Smaller institutions should avoid measuring themselves only against mega-application schools. A more useful benchmark is the number of qualified, reachable, and financially viable applicants per program. A niche master's degree, certificate, or bootcamp can perform well with a smaller applicant pool if the audience is precise and the conversion process is strong.
This is where Research.com can be especially useful. Research.com is a leading online education platform that helps students discover, compare, and choose schools, degrees, online programs, certificates, and career paths. Because the platform reaches more than 12 million students and learners each year, institutions can appear while students are actively researching options rather than passively scrolling through unrelated media.
Why do accepted students not enroll?
Accepted students often do not enroll because admission solves only one part of the decision. After acceptance, students still compare cost, financial aid, location, online flexibility, family responsibilities, career outcomes, schedule fit, and confidence in the institution. The more expensive or life-changing the program, the more reassurance students need before committing.
Affordability is one of the most visible barriers. College Board's 2024 data showed published tuition and fees of $11,610 for in-state students at public four-year institutions and $43,350 at private nonprofit four-year institutions. Even before housing, books, transportation, and lost work time, these prices force students and families to evaluate value more carefully.
The most common reasons admitted students fail to enroll tend to fall into a few categories. Recruitment teams should investigate these causes before assuming the issue is simply weak sales follow-up.
- Cost uncertainty: Students do not understand net price, aid timing, payment options, employer reimbursement, or loan implications.
- Competing offers: Another school appears less expensive, more prestigious, closer to home, faster, or more flexible.
- Weak program confidence: Students cannot clearly see career outcomes, curriculum relevance, accreditation, faculty credibility, or student support.
- Process friction: Required documents, placement tests, advising steps, technology setup, or transfer-credit reviews take too long.
- Life constraints: Work schedules, childcare, transportation, health, relocation, or family obligations make attendance difficult.
- Low emotional commitment: Students applied casually or as a backup and never developed a strong connection to the institution.
A common mistake is treating admitted students as if they have already been won. In reality, the admit stage should trigger the most personalized communication in the funnel: financial clarity, program-specific reassurance, student support proof, and fast access to an advisor who can answer practical questions.
Which factors most influence college choice?
College choice is influenced by a mix of rational and emotional factors. Students evaluate whether they can afford the program, whether it fits their career goal, whether the format works for their life, and whether they trust the institution enough to commit. Parents, employers, counselors, peers, rankings, reviews, and AI-generated summaries can also shape perception before a student ever contacts admissions.
For traditional undergraduates, campus experience, academic reputation, financial aid, location, and family input often matter heavily. For working adults, graduate students, certificate buyers, and career changers, the decision often centers on flexibility, speed, cost, credential value, and whether the program appears directly connected to employment or advancement.
The following factors are especially important because they influence both application volume and yield. Marketing teams should make these points visible before asking students to inquire or apply.
- Net cost and payment clarity: Students need to understand the likely out-of-pocket price, not only published tuition.
- Career relevance: Program pages should connect curriculum, skills, credentials, and likely career pathways without promising guaranteed outcomes.
- Flexibility: Online, hybrid, evening, accelerated, and part-time options can expand demand among working adults.
- Trust signals: Accreditation, rankings, faculty expertise, student services, employer relationships, and transparent outcomes reduce perceived risk.
- Speed of response: High-intent prospects often compare several schools at once, so delayed follow-up can shift the decision to a competitor.
- Belonging and support: First-generation students, adult learners, and career changers want evidence that the institution understands their situation.
Research.com supports this decision journey by placing institutions in a trusted research environment where students are already comparing education options. For colleges, online degree providers, course platforms, and agencies, that context can be more valuable than broad reach because the student is already asking the kinds of questions that lead to an enrollment decision.
How do application trends vary by institution type?
Application trends vary widely by institution type because students are no longer following one standard path. Some students still pursue residential four-year degrees, but many others are considering community colleges, online bachelor's programs, graduate certificates, bootcamps, employer-aligned training, and stackable credentials.
National Student Clearinghouse's fall 2024 reporting showed continued strength in undergraduate enrollment recovery, with particularly notable momentum in community colleges. That matters because community colleges often serve price-sensitive, transfer-oriented, adult, and career-focused learners-the same audiences many online and certificate providers are trying to reach.
The table below compares major institution types from a recruitment perspective. It helps marketers identify which message and funnel design usually fit each sector.
| Institution type | Application trend pattern | Best-fit recruitment message |
| Selective four-year universities | High application volume, intense competition, and strong brand-driven demand | Academic fit, outcomes, community, prestige, and admitted-student yield |
| Regional public universities | Demand depends heavily on geography, affordability, and program relevance | Value, local access, transfer pathways, support, and career preparation |
| Community colleges | Often shaped by cost sensitivity, workforce goals, and transfer intent | Affordability, flexibility, short-term credentials, transfer options, and local employer alignment |
| Graduate programs | Program-specific demand; students compare ROI, flexibility, and reputation | Career advancement, faculty credibility, format, cost, and time to completion |
| Online degree programs | Demand is search-driven and comparison-heavy | Flexibility, accreditation, support, transfer credit, outcomes, and transparent pricing |
| Bootcamps and certificates | Demand follows labor-market signals and career-change urgency | Skills, portfolio value, schedule, financing, employer relevance, and learner support |
Search behavior is also changing. Prospective students increasingly discover schools through search engines, rankings, comparison pages, social proof, and AI-generated answers. Institutions that want to compete in this environment need strong technical content, clear program information, and credible third-party visibility; for agencies, this makes SEO for universities a core part of acquisition strategy rather than a secondary brand activity.
How can colleges improve inquiry-to-enrollment conversion?
Colleges can improve inquiry-to-enrollment conversion by treating recruitment as a full-funnel system rather than a collection of disconnected campaigns. The goal is not simply to generate more names. The goal is to attract the right students, answer their decision questions, reduce friction, and prove value before competitors do.
A strong conversion system usually includes the following steps. These actions are most useful when marketing, admissions, financial aid, and program leadership share the same funnel data.
- Define the ideal student by program: Separate first-time undergraduates, transfers, graduate students, adult learners, military-affiliated students, and career changers because each group evaluates risk differently.
- Match channels to intent: Use SEO, comparison platforms, and content for research-stage demand; use paid search for active program searches; use retargeting and email for students who need reassurance.
- Improve landing-page clarity: Every program page should answer cost, format, curriculum, accreditation, outcomes, admissions requirements, transfer credit, and next steps.
- Speed up follow-up: High-intent inquiries should receive fast, helpful contact that answers the question they actually asked rather than a generic admissions script.
- Personalize nurture by barrier: Send different messages to students worried about cost, schedule, transfer credits, employer approval, or career value.
- Audit application friction: Track where students stop, which documents slow them down, and which steps require unnecessary manual effort.
- Connect marketing to enrollment outcomes: Optimize toward enrolled students and retained students, not just low-cost leads.
One common red flag is a campaign that lowers cost per lead while lowering application and enrollment quality. If cheaper leads do not convert, the campaign has reduced visible marketing cost while increasing admissions workload. Teams that need a stronger foundation can use this guide to college lead generation to align source quality with enrollment goals.
Research.com can support this system by connecting institutions with students during the research and comparison stage. Its advertising and partnership models include CPC campaigns, CPL lead generation, sponsored placements, content partnerships, custom advertising packages, and strategic education marketing partnerships, giving schools flexibility to test visibility, traffic, and inquiry generation without relying on one acquisition model.
Which channels drive the highest-quality applicants?
The highest-quality applicant channels are usually the ones that capture existing intent or create trust before the student submits a form. In education marketing, quality is not just whether a lead has a valid phone number. It is whether the student is academically eligible, financially realistic, program-aligned, responsive, and likely to enroll.
Different channels serve different jobs in the funnel. The best recruitment systems use a portfolio approach instead of expecting one channel to do everything.
- Organic search and AI discovery: Strong for students researching programs, costs, careers, rankings, and comparisons; quality is often high when content matches specific intent.
- Paid search: Strong for active demand, especially program-specific searches, but costs can rise quickly in competitive categories.
- Education comparison platforms: Strong for reaching students who are already evaluating options and need help narrowing choices.
- Retargeting: Useful for bringing back researchers who visited program pages but did not inquire or apply.
- Email and SMS nurture: Effective after inquiry when messages are personalized around cost, deadlines, format, and next steps.
- Partnerships and affiliates: Useful for scale, but require strict quality controls and transparent source reporting.
- Social media: Strong for awareness, storytelling, and remarketing, but often weaker for immediate enrollment intent unless targeting and creative are precise.
Research.com is particularly strong for high-intent discovery because most of its traffic comes from search engines and AI/LLM discovery. That means users often arrive while actively asking education questions, comparing schools, or exploring career pathways. For advertisers, this creates an opportunity to reach students in a trusted content environment rather than relying only on interruption-based ads.
Agencies and institutions should also adapt to AI-driven discovery. As students ask tools like ChatGPT and search AI summaries for program recommendations, institutions need accurate, authoritative, and well-structured content across their own sites and trusted third-party platforms. This guide to LLM visibility for education explains how agencies can help clients become more discoverable in AI-assisted research journeys.
How can colleges measure recruitment ROI accurately?
Colleges can measure recruitment ROI accurately only if they connect marketing spend to enrolled students, not just inquiries or applications. Because the path from first visit to enrollment can take weeks or months, ROI measurement requires source tracking, CRM discipline, admissions data, and agreement on what counts as a conversion.
The most useful ROI model starts with economics. Cost per lead can help manage efficiency, but cost per application, cost per admit, cost per enrollment, and revenue or tuition contribution per enrolled student are more decision-ready metrics. If available, first-term persistence and credit completion should also be included because a channel that produces students who immediately stop out may not be as valuable as it appears.
A reliable education marketing dashboard should include these metrics. Each one answers a different leadership question.
- Cost per inquiry: Shows how efficiently a channel produces initial interest, but does not prove enrollment value.
- Inquiry-to-application rate: Shows whether the channel attracts students with enough intent to take the next step.
- Application completion rate: Reveals friction and seriousness of intent.
- Acceptance rate by source: Shows whether leads are academically and programmatically qualified.
- Admit-to-enrollment yield: Shows whether accepted students from a source actually choose the institution.
- Cost per enrollment: Connects marketing investment to the outcome that matters most.
- Student quality indicators: Persistence, credit load, payment status, and engagement help separate short-term volume from sustainable growth.
The biggest measurement mistake is giving full credit to the last click. A student may discover a program through search, read a ranking page, attend a webinar, receive emails, compare costs, and then return through a branded ad before applying. If the dashboard credits only the final ad, budget may shift away from the content and partnerships that created trust.
For agencies building enrollment marketing campaigns, the stronger approach is to report by funnel stage and source quality. This makes it easier to defend investment in SEO, content, Research.com partnerships, paid search, nurture, and conversion-rate improvements even when enrollment decisions take time.
Research.com can fit into ROI measurement because its flexible CPC, CPL, sponsored, content, and custom partnership models allow advertisers to test different objectives. Whether the goal is qualified traffic, student inquiries, program visibility, or category awareness, teams can structure campaigns around the metric that best matches their enrollment challenge.
Other Things You Should Know
Applicants are individual students. Applications are the submissions those students send to colleges or programs. One applicant can submit multiple applications, so application volume usually exceeds the number of people applying.
Students may be applying to more schools, comparing prices more carefully, or using applications as a backup. Enrollment depends on yield, affordability, program fit, financial aid, and follow-up after acceptance.
Cost per enrollment is usually more useful than cost per lead because it connects marketing spend to actual student acquisition. Teams should still monitor each funnel stage to diagnose where prospects drop off.
A strong page should clearly explain cost, format, curriculum, admissions requirements, accreditation, outcomes context, transfer credit, and next steps. Teams building online or certificate pages can use this guide on how to build a course landing page to improve clarity and conversion.
References
- Avoid these 3 things to ensure accepted students choose you https://www.highereddive.com/spons/avoid-these-3-things-to-ensure-accepted-students-choose-you/743925/
- Ten Factors that Influenced the Decision to Apply in 2023 — Academica Forum https://forum.academica.ca/forum/ucas2024-10-factors-influencing-choice
- Ivy League & College Acceptance Rates https://toptieradmissions.com/resources/college-acceptance-rates/
- These colleges are getting the most applicants https://www.mycentraljersey.com/story/news/education/college/2026/01/31/these-colleges-are-getting-the-most-applicants/88405933007/
- Enrollment & Admissions Conversion Rates 101 | LeadSquared https://www.leadsquared.com/us/industries/education/admissions-and-enrollment-conversion-rates/
- College Enrollment Statistics [2026]: Total + by Demographic https://educationdata.org/college-enrollment-statistics
- How to Measure Recruitment ROI | Automated Analytics https://automatedanalytics.co/insights/how-hiring-teams-can-accurately-measure-recruitment-roi/
- Average conversion rate in education admissions (and how to improve it) | Reshape https://reshapeos.com/blog/average-conversion-rate-in-education-admissions-and-how-to-improve-it
- How to Optimize Your Multi-Channel Recruiting Strategy to Reach Top Talent in 2026 | RecruitBPM https://recruitbpm.com/blog/how-to-optimize-your-multi-channel-recruiting-strategy-to-reach-top-talent-in-2026
- How Colleges Get Admitted Students to Enroll https://www.saraharberson.com/blog/how-colleges-get-admitted-students-to-enroll