
2027 Reading an Epidemiology Table Before Your First Public Health Internship

Co-Founder and Chief Data Scientist
An epidemiology table may be the first piece of evidence an internship supervisor asks you to explain. Reading it accurately means more than finding the largest number: you need to know who was counted, what the denominator represents, and whether groups can fairly be compared.
This guide is for students preparing for a first public health placement. It walks through a hypothetical table, identifies the skills worth practicing beforehand, and shows when a course or supervised experience - not another degree - is the best next step.
Key Things You Should Know
- Read the title, population, time period, row labels, column labels, and footnotes before calculating anything; a count without its denominator can mislead.
- In the illustrative example below, 40 cases among 200 people is 20%, while 20 among 200 is 10%; the risk ratio is 2, but that comparison alone does not establish causation.
- Before your placement, practice checking denominators, missing values, and disclosure rules with a supervisor; introductory epidemiology and statistics are usually more useful for this task than an advanced credential.
What Is an Epidemiology Table and Why Does It Matter in Public Health?
An epidemiology table organizes observations about a population - for example, cases by age group, exposures by location, or outcomes over time. An intern might use one to help prepare a surveillance summary, check a program report, or explain an apparent difference between groups. The table supports a decision only if the reader understands its population, definitions, measurement period, and data source.
Start with the question the table was built to answer. A table of reported cases describes reports, not necessarily every infection in a community. A table of clinic patients describes people who reached those clinics, not automatically everyone living nearby. Footnotes may reveal exclusions, revised case definitions, or suppressed values that change the interpretation.
If you are still building undergraduate preparation, compressed-term online public health BS pathways are one possible route to coursework. For this immediate internship skill, however, check whether you can take introductory epidemiology and statistics soon enough to use them before placement.
How Do You Read Rows, Columns, Rates, Ratios, and Percentages?
Read each cell at the intersection of its row and column, then ask what quantity the column represents. In the illustrative, invented table below, "cases" is a count, "people observed" is the denominator, and "risk" is the share of that group recorded as a case during the same hypothetical observation period. The groups are not real populations or study results.
| Illustrative group | Cases | People observed | Risk during the period |
| Group A | 40 | 200 | 20% |
| Group B | 20 | 200 | 10% |
Divide cases by people observed within each row: 40 ÷ 200 gives 20% for Group A; 20 ÷ 200 gives 10% for Group B. The risk ratio is 20% ÷ 10%, or 2. The risk difference is 10 percentage points. These describe the hypothetical groups, not why they differ. Differences in age, access to testing, exposure measurement, or who entered the dataset could affect the comparison.
A percentage needs a named denominator: "20% of Group A" is clearer than "20% had the outcome." A rate may instead use person-time, such as cases per person-year, when people are followed for different lengths of time. Do not call the risks in this table incidence rates. Likewise, a ratio compares two quantities, but its meaning depends on which one is in the numerator.
Before making calculations in a placement, check whether totals include missing or "unknown" records and whether groups overlap. If a graduate program allows students to strengthen quantitative preparation after an initial application review, reviewing conditional public health graduate entry may be useful; an admission arrangement does not replace learning to interpret the table.

What Skills Do Epidemiology Internships Require Before Your First Placement?
For a first placement, aim to explain a table accurately under supervision rather than claim independent epidemiologist-level expertise. Useful starting skills include working with a spreadsheet, checking totals against source notes, distinguishing counts from population-adjusted measures, and writing one plain-language conclusion with a limitation. An internship may require different software or data permissions, so ask the site what its actual tasks involve.
Use this short practice sequence with a public or instructor-approved table before your start date:
- Write down the population, observation period, outcome definition, and source.
- Label each numerator and denominator; recalculate one displayed percentage.
- Identify missing values, suppressed cells, and any footnote that changes a comparison.
- Draft two sentences: what the table shows and what it cannot establish.
- Ask a supervisor to review your interpretation before using it in a report.
Do not copy restricted records into a personal spreadsheet or portfolio. Site rules, data-use agreements, and applicable privacy requirements determine what you may access and share. If further coursework is necessary, compare the actual price and conditions of training rather than assuming a graduate award will cover it; information on public health graduate tuition after institutional funding is a starting point for that separate financial decision.
Introductory epidemiology teaches measures of disease frequency, comparison groups, study designs, and common biases. Introductory biostatistics helps you interpret variation and uncertainty rather than treating every difference as meaningful. A data-management or spreadsheet course adds practical skills: documenting variables, checking missing entries, and reproducing calculations. A surveillance or program-evaluation course is most useful if it matches the placement's work.
Choose the smallest learning sequence that closes your gap. If you can read risks but not explain confidence intervals, add statistics practice. If you understand formulas but misread who is included, work on study design and data documentation. If the internship involves community reporting, practice explaining findings without implying that a group characteristic caused an outcome.
Research-intensive doctoral coursework is not a prerequisite for reading your first internship table. Students considering that longer route should separately compare research opportunities and epidemiology doctoral tuition support; funding options do not make a doctorate the most direct solution to an introductory methods gap.
A public health bachelor's student may qualify for supervised data-support or program internships, while an MPH commonly combines population-health practice with epidemiology and biostatistics. A research-oriented epidemiology MS may offer deeper methods training. Doctoral study serves more specialized research or advanced practice goals; it is not needed simply to interpret a table. Internship eligibility and eventual job qualifications depend on the particular school, host, and employer - not the degree name alone.
For an early-career student, the better question is which pathway gives you enough methods instruction and an approved opportunity to apply it. Ask who secures placements, what supervision is available, and whether students actually work with appropriately accessible data. A targeted course plus a supervised project may be more efficient than enrolling in another degree.
If a doctorate is a later goal, comparing public health doctorate tuition and length is a separate decision from internship readiness; neither cost nor duration alone establishes research fit or career outcomes.
Either format can teach table interpretation. Compare access to instructor feedback, software, datasets you are authorized to use, and supervised fieldwork rather than assuming one delivery mode teaches methods better. An online lecture may be asynchronous while live labs, group analysis, or an internship follow fixed hours. A campus program may make in-person collaboration easier but require travel and a less flexible schedule.
Ask how students receive feedback on incorrect interpretations, whether methods courses have live attendance requirements, and where placements can occur. If a program advertises remote study, confirm separately whether the internship can be completed remotely and who approves its site and supervisor.
The same distinction matters when evaluating online public health doctorate pathways: online coursework does not establish that research supervision, campus visits, or applied work will be remote. Those advanced-program questions should not distract from finding a workable first placement.
Requirements vary by degree and institution. Undergraduate programs may specify major prerequisites; MPH programs may welcome varied majors while expecting evidence of quantitative readiness; a methods-intensive MS may ask for more mathematics or research preparation. Doctoral applicants may need to demonstrate research or practice fit. None of these general patterns establishes the requirements of a particular program.
If you are seeking an internship now, verify your own school's enrollment, course-sequencing, and placement rules before planning an additional degree. If graduate study is the next step, read the current admissions page for required courses, accepted alternatives, application documents, and deadlines. A lower GPA should prompt a documented plan to show readiness - not an assumption that admission is impossible; guidance on public health graduate GPA requirements and alternatives can help frame questions for admissions staff.
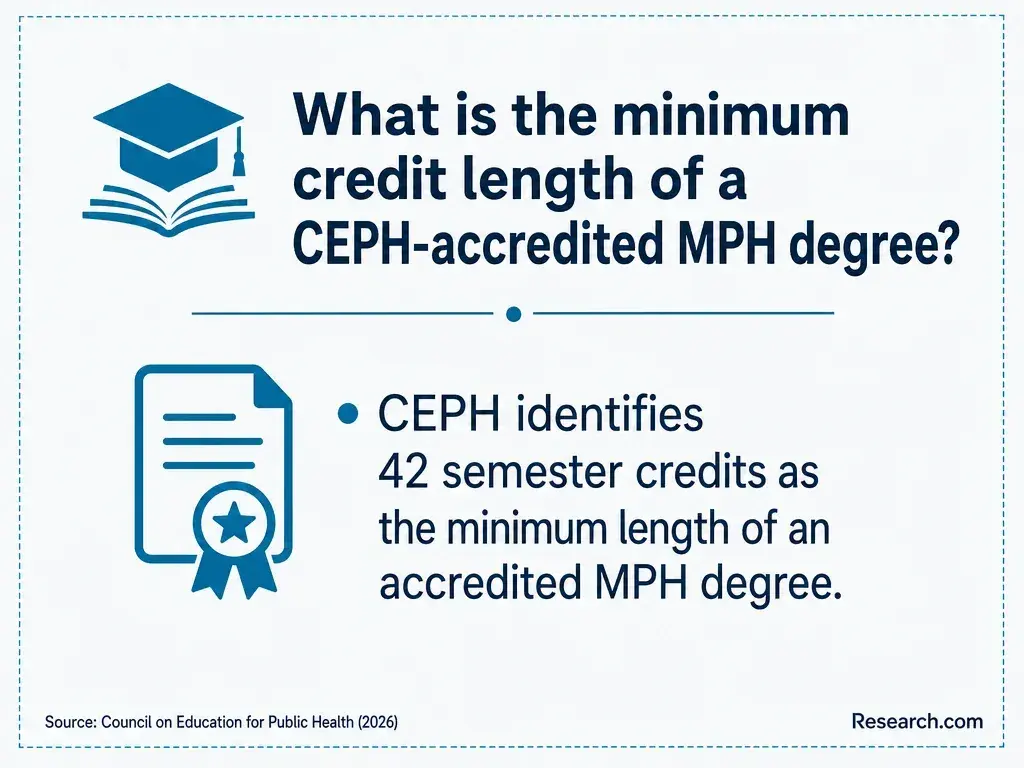
Check two different things: the institution's recognized institutional accreditation and whether the exact public health school, unit, or program - and the degree you intend to pursue - falls within Council on Education for Public Health (CEPH) accreditation. A university's status does not by itself establish CEPH coverage for every epidemiology degree. Confirm scope through the accreditor and the program, especially if a credential or employer specifies it.
Quality for this particular goal also means access to introductory methods courses, feedback on written interpretations, qualified supervision, and a realistic placement process. Ask to see a course sequence and internship requirements rather than relying on a program's broad description. A guide to choosing an MPH with CEPH accreditation can support a comparison, but verify each program's current scope and your intended degree independently.
A first internship may lead toward data assistant, surveillance support, research coordinator, or program-evaluation work, depending on the tasks you can demonstrate. Epidemiologist positions commonly require at least a master's degree, according to the US Bureau of Labor Statistics Occupational Outlook Handbook; employers may also expect relevant analytic experience. A student who accurately documents and explains a table has useful portfolio evidence, but that one skill does not qualify them to design studies or direct surveillance independently.
For salary and outlook decisions, use the Bureau of Labor Statistics' latest epidemiologists occupational profile and note its wage reference year and projection period. Its national occupational median is not an entry-level offer, an internship wage, or the expected salary of graduates from a particular program. Compare local job postings for the specific duties and degree level you want before paying for more education.
If your target is a practice-oriented role rather than a specialist research position, MPH programs with broader admissions criteria may warrant comparison. Admissions flexibility is not evidence that a program supplies the quantitative training an epidemiology job requires.
Which Certifications and Professional Standards Apply to Epidemiologists?
There is no single universal certification or clinical license conferred by an epidemiology degree. The Certified in Public Health (CPH) credential has eligibility and examination rules set by its certifying body; CHES and MCHES address health education and follow different rules. Check a target employer's posting before spending time or money on a credential that may not apply to its epidemiology work.
The most immediate professional standard for an intern is responsible handling and communication of evidence: use approved data, retain definitions and caveats, protect confidential information, and have a supervisor review work before release. If doctoral training later becomes relevant, public health doctorate admissions flexibility should be evaluated separately from certification and from your present obligation to interpret data carefully.
Other Things You Should Know About Public Health
Do not estimate or reverse-engineer a suppressed count. Follow the source's disclosure rules, and ask your supervisor how to describe the pattern without revealing protected information.
Only if the site permits that specific use. A table available to you at work is not automatically approved for public sharing; consider an authorized public dataset or a clearly labeled practice example instead.
Use the corrected version, record its publication or revision date, and revisit any calculations or conclusions based on the earlier table.
Check labels, units, grouping, rounding, and update dates before choosing either interpretation. If the discrepancy remains, flag it for the source owner or your supervisor rather than silently selecting the more persuasive display.
- Analyzing and Interpreting Data | Field Epi Manual https://www.cdc.gov/field-epi-manual/php/chapters/analyze-interpret-data.html
- Types of Percentages in Different Studies and Their... - PMC https://pmc.ncbi.nlm.nih.gov/articles/PMC13451532/
- Principles of Epidemiology: Lesson 4, Section 2 | cdc.gov https://archive.cdc.gov/www_cdc_gov/csels/dsepd/ss1978/lesson4/section2.html
- Cross-sectional research: A critical perspective, use cases, and recommendations for IS research - ScienceDirect https://www.sciencedirect.com/science/article/abs/pii/S0268401223000063
- 12.5 Epidemiologic Measures - Population Health for Nurses | OpenStax https://openstax.org/books/population-health/pages/12-5-epidemiologic-measures
- Introduction to 2 x 2 Tables, Epidemiologic Study Design, and Measures of Association - Foundations of Epidemiology https://open.oregonstate.education/epidemiology/chapter/introduction-to-2x2-tables-epidemiologic-study-design-and-measures-of-association/


