60 University Statistics: 2026 Data, Trends & Predictions
Co-Founder and Chief Data Scientist
As bastions of knowledge, universities are expected to provide high-quality programs and a conducive scholarly environment for teachers and students alike. These are designed to be safe spaces for people to explore the world of knowledge and learn how they can contribute to their chosen fields. But, there are many factors that affect student experience at a university. These include funding, diversity, and, of course, the cost of attending. As such, it is important to understand the current state of universities.
This article aims to address this by shedding some light on the different university statistics from the financial state of higher education institutions to their enrollment rates. With the topics discussed here, university administrators, educators, as well as students can better understand what factors are affecting how universities are run today and where the sector is headed in the coming years.
University Statistics 2026 Table of Contents
- General University Statistics
- Financial State of University Statistics
- University Enrollment Statistics
- University Teaching Methods Emerging Trends
- Online Education and Its Role in Expanding Accessibility
- How Do Competency-Based Programs Align Education with Industry Demands?
- What Role Do Student Support Services Play in Academic and Career Development?
- Are Accelerated Degree Programs a Strategic Alternative to Traditional Education?
- Is a Graduate Degree an Effective Pathway for Career Change?
- Cost of Studying at a University
- What are the benefits of obtaining a four-year degree?
- How Do Specialized Online Programs Enhance Career Opportunities?
- What is the Return on Investment of a University Education?
- Universities Remain as Key Components of Global Progress
General University Statistics 2026
According to Statista's latest data, the American public is becoming more educated through the years. That is, we can see a smooth progression if we compare the percentage of adults that graduated college from the past to the present. From 27.7% of college graduates in 2004 to 32% in 2014 to 38.7% in 2024. These are good figures and they result from several factors working together, such as the increase in the number of universities in the U.S. and more accessible university programs.
- Currently, there are more than 25,000 universities around the world.
- There are 14,103 officially recognized universities in Europe.
- There are around 6,350 recognized universities in Asia.
- The U.S. has about 4,138 universities and colleges. 4,042 are located within the 50 states and 96 are from other American jurisdictions.
- Among the universities in the U.S., there are 1,636 are public institutions and 1,664 are nonprofit.
- 768 of the U.S. universities fall under the public four-year institution category and 868 are public two-year.
- There are also 742 for-profit universities in the U.S.; 358 of which are four-year institutions while 384 are two-year institutions.
- California is the state with the highest number of universities: 259 four-year schools and 161 two-year institutions.
- With one four-year university and eight two-year institutions, Wyoming has the least number of universities among the states of America.
- Times Higher Education ranked the University of Oxford as the number one university in the world in 2026—its 10th consecutive year on the top spot—with an overall score of 98.2. It is followed by the Massachusetts Institute of Technology, which scored an overall of 97.7 points.
- MIT is the number one university in the world in 2026, according to QS World University Ranking.
- Using the same ranking, the University of Oxford is the top school in Europe, followed by ETH Zurich in second place in 2026. Tied in the third spot are the Imperial College London and University College London.
- Meanwhile, in Asia, the University of Hong Kong lands the top spot in 2026. It is followed by Peking University in second place, and Singapore's Nanyang Technological University and National University of Singapore tied in third place.
- For the Class of 2028, Dartmouth College has the highest overall acceptance rate among Ivy League schools. It accepted 1,710 applicants out of 31,656.
- Meanwhile, Harvard University has the lowest acceptance rate with 3.49%, accepting 1,937 out of 54,008 applicants for the Class of 2028.
- For the Class of 2026, when all data was available for all Ivy League schools, Cornell had the highest acceptance rate overall, at 6.91%, and Harvard retained its place with the lowest overall rate, at 3.19%.
Financial State of Universities
University-level education is a billion-dollar market that is expected to further grow over time, as shown in the following set of statistics. However, as geopolitical conflicts continue, the future of higher education is filled with uncertainties. Bumpy weeks are sure to follow and smaller institutions are more likely to suffer a major blow.
- The global higher education market was valued at $1,042.31 billion in 2025 and is projected to reach $3,024.89 billion by 2035.
- Between 2026 and 2034, the market size of U.S. colleges and universities will grow by 11.4% annually on average.
- The North American region gained the highest revenue share in 2025, at 34%.
- Private universities and college around the world also had the highest revenue share during the same year, at 57%.
- The market size of U.S. universities and colleges by 2034 is estimated to be $18.1 billion.
- The global online education market size is projected to reach $319.167 billion in 2025, at a CAGR of 9.23%.
- Amid ongoing budget slashes, the U.S. Department of Education will face a 3% cut for the 2027 fiscal year.
- This means a loss of $2.7 billion in higher education programs, according to a Higher Ed Dive analysis (2026).
- The Federal Work-Study program would also lose 90% of its funding compared to 2025 levels.
- This budget proposal would also cut funding in key U.S.D.E. agencies important to colleges and universities, such as the Office for Civil Rights which handles discrimination and harassment. The office will get a 35% reduction from 2025 levels.
- The Institute of Education Sciences would also lose 67.1% of its funding compared to 2025 levels. The institute collects statistical records from K-12 schools and higher educational institutions.
- Budget cuts would also affect other non-U.S.D.E. agencies, like the National Institutes of Health (reducing $5 billion from its funding) and the National Science Foundation (leading its funding to only $4 billion).
- The College Board's latest report (2025) found that funding for public universities and colleges across all states was around $11,680 per full-time equivalent (FTE) student.
- Meanwhile, the National Center for Education Statistics (NCES) reported that public higher ed institutions following GASB standards had a revenue of $553,403,556 in 2024.
- In contrast, private nonprofit institutions gained $327,348,748 in revenue.
- Lastly, private for-profit had a revenue of $20,101,654.
University Enrollment Statistics
Any change, trend, or news about the higher education sector is sure to affect the enrollment rate of universities. Add to that the personal circumstances of students and their families. This is why it is not surprising for enrollment figures to regularly fluctuate. Similarly, dropout rates are an interesting point of the matter as they can be affected by various enrollment trends.
- In fall 2025, the total undergraduate enrollment in the U.S. was 16.2 million, up 1.2%.
- Meanwhile, the graduate enrollment was 3.2 million, down 0.3%.
- Across sectors, public 4Y institutions had the highest enrollment, at 6,379,669.
- Community colleges came close, with 6,026,042 enrollees.
- Private nonprofit institutions had an enrollment of 2,742,163.
- Lastly, private for-profit had 648,120 enrollees.
- Bachelor's degree enrollees during the same period reached 5,755,025 in public institutions.
- Bachelor's degree enrollment in private nonprofit schools was 2,499,663.
- In private for-profit institutions, enrollment was 477,890.
- In community colleges, bachelor's degree enrollees reached 82,036, while associate degree enrollees reached 4,405,649.
- Full-time students mostly populated colleges and universities, at 6,148,178 in total in public institutions. Meanwhile, part-time students accounted only 1,817,552.
- Community colleges had the most number of part-timers, at 3,848,829.
- In America, among college dropouts, 30% are freshman and a 40% overall dropout rate for undergraduate students.
- 35% of Asian students dropped out at two-year colleges while only 10% of them dropped out at four-year institutions.
- The most prominent reason for student dropout is financial constraints (38%) followed by academic disqualification (28%).
- Meanwhile, 3% of students dropouts in universities were because of emotional/mental issues and 5% state that their health condition does not allow them to push through with their studies.
- 36% of Alaska Natives/American Indians were more likely to drop out after their first two years in four-year colleges.
University Teaching Methods Emerging Trends
With the advent of technology and evolving educational needs, universities are continuously adapting their teaching methods to enhance learning experiences. Some of the emerging trends in university teaching in 2026 include:
- Blended Learning: Combining in-person and online instruction, blended learning offers flexibility while maintaining student engagement. This method allows students to learn at their own pace while benefiting from classroom interaction.
- Microcredentials and Short Courses: Universities are increasingly offering short-term courses and microcredentials to meet the demand for specialized skills in a rapidly changing job market. These are often more affordable and can be stacked towards full degrees.
- Experiential Learning: Universities are incorporating more hands-on learning experiences such as internships, co-ops, and research projects, ensuring students gain practical skills that complement theoretical knowledge.
- Gamification: Integrating game elements into coursework has proven effective in increasing student engagement and motivation. Points, leaderboards, and rewards make learning more interactive and enjoyable.
- AI and Adaptive Learning: Artificial intelligence tools are being used to create personalized learning experiences, adapting to each student’s strengths and weaknesses in real-time.
Online Education and Its Role in Expanding Accessibility
Online education has become a transformative force in the higher education landscape, helping to address key barriers such as cost, geographic limitations, and scheduling conflicts. This shift has enabled a broader demographic of students to pursue degrees without compromising responsibilities like work or family obligations. In particular, online master's programs have gained significant traction in recent years, offering specialized education to improve career prospects while maintaining flexibility.
Additionally, for those concerned about affordability, exploring the cheapest online master degree programs can lead to high-quality yet budget-conscious options. These programs represent a new wave in education, prioritizing accessibility without sacrificing academic rigor. Universities and educators must continue leveraging this model to cater to diverse learning needs, ensuring that higher education adapts to global economic and technological changes.
How Do Competency-Based Programs Align Education with Industry Demands?
Competency-based programs emphasize mastery of skills over time-based progression, offering an alternative pathway that directly links learning outcomes with industry requirements. This model employs flexible curricula and practical assessments to ensure that graduates attain measurable capabilities that resonate in today’s professional landscape. Institutions adopting this approach provide targeted frameworks, such as a competency based doctorate program, designed to streamline advanced learning and facilitate accelerated career readiness without redundant coursework.
What Role Do Student Support Services Play in Academic and Career Development?
Student support services—including academic advising, mental health counseling, tutoring, and career planning—are instrumental in guiding students through the academic landscape and enhancing professional trajectories. These services help tailor personalized study strategies, streamline degree selection processes, and improve overall educational outcomes. Their integration with flexible learning models, such as cheapest online masters, ensures that students can efficiently balance academic commitments with financial and personal considerations, ultimately maximizing their return on investment in higher education.
Are Accelerated Degree Programs a Strategic Alternative to Traditional Education?
A growing number of learners are evaluating accelerated programs as efficient pathways to acquire qualifications and enter the workforce sooner. These programs emphasize a condensed academic schedule, enabling students to complete degree requirements in a reduced timeframe while adhering to rigorous academic standards. Leveraging such accelerated pathways may be particularly beneficial for professionals aiming to enhance their career profiles without incurring the prolonged financial and time commitments associated with traditional degree programs. For instance, prospective students can explore options like fast track associates degree to align their educational investments with immediate industry needs and evolving labor market demands.
Is a Graduate Degree an Effective Pathway for Career Change?
Advanced degree programs can offer structured pathways for professionals seeking to transition into new industries. Focusing on practical skills and strategic networking, these programs address the skills gap that often hinders career change. They provide targeted curricula designed to meet evolving market demands, ensuring graduates are well-equipped with both theoretical knowledge and applied expertise. For those intent on redefining their professional trajectory, exploring the best masters degree for career change can be a crucial step toward aligning academic pursuits with long-term career objectives.
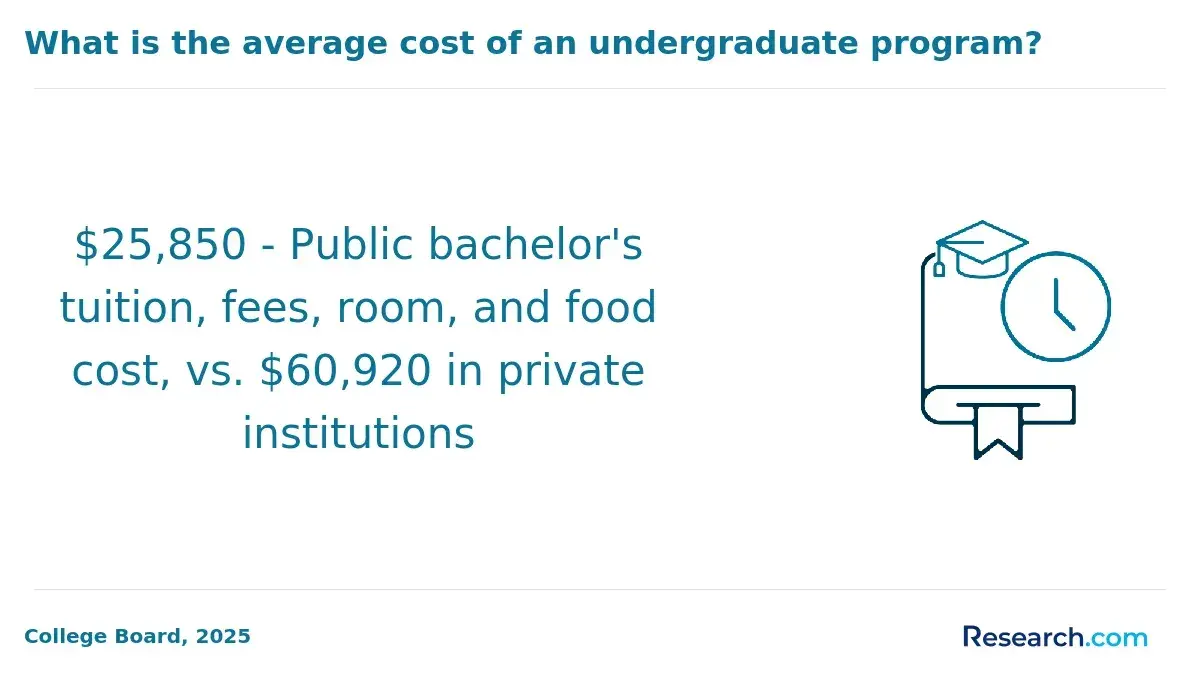
Cost of Studying at a University
While tuition is the first thing that comes to mind when the cost of studying is talked about, it is far from being the only concern of university students. Learning materials such as books, cost of rent, and events like field trips are just a few concerns that students and their families must take note of. Even then, expenses can still greatly vary when you consider other important factors, such as the course of the students and the type of institution they are planning to go to. With that said, top colleges that pay off the most are in demand. To get you ready for typical expenses, here are some of the costs that a student will have to shoulder when pursuing studies in a university.
- The average annual tuition fee at MIT is around $66,720. Meanwhile, at Harvard University, it is $59,320.
- The average yearly tuition fee at the University of Cambridge is between £29,052 and £70,554, depending on the course, and between £37,380 and £62,820 at the University of Oxford for international students.
- Tsinghua University in China costs around RMB26,000 to RMB40,000 while the University of Barcelona’s tuition fee is approximately €1,800 to €5,000 for international students.
- In 2025, the published tuition and fees in public 2Y institutions was $4,150.
- In public 4Y institutions, tuition and fees cost $11,950 in-state and $31,880 out-of-state.
- Private nonprofit 4Y institutions charged $45,000 for tuition and fees.
- However, the net cost of attendance after financial aid was $15,980 in public 2Y institutions.
- This amount was $21,340 in public 4Y institutions.
- And the COA in private nonprofit 4Y institutions was $37,380.
- For graduate tuition, the published tuition and fees for master's degree programs in public institutions was $9,850 and $32,600 in private nonprofit schools.
- The master's degree tuition, fees, room, and food cost in public universities was $22,080 in public institutions and $47,470 in private institutions.
- For doctorate programs, tuition and fees reached $12,720 in public institutions and $54,090 in private nonprofit schools.
- The doctorate tuition, fees, room, and food cost in public universities was $26,830 in public institutions and $72,420 in private institutions.
- Financial aid amounts per full-time-equivalent (FTE) undergraduate student were as follows: $12,080 in grants, $3,790 in federal loans, and $940 in other aid.
- For FTE graduate students, the aid amounts given were: $10,960 in grants, $17,710 in federal loans, and $490 in other aid.
What are the benefits of obtaining a four-year degree?
A four-year degree remains a powerful credential for many individuals seeking to improve their career prospects and personal growth. Here are some key benefits that make earning a four-year degree a valuable investment:
- Higher Earning Potential: On average, individuals with a four-year degree earn significantly more over their lifetime compared to those with only a high school diploma. Graduates can expect higher starting salaries and better long-term financial outcomes. For more details, explore the best paying bachelor degrees, which highlight high-earning fields that require a four-year degree.
- Increased Job Opportunities: Many employers require applicants to have a four-year degree, even for entry-level positions. A degree opens up a wider range of job opportunities in various industries, from business to healthcare, technology, and beyond.
- Skill Development: A four-year education helps students develop a wide range of skills, including critical thinking, problem-solving, communication, and technical expertise. These skills are highly valued in the job market.
- Personal Growth and Networking: College is not only about academics but also about personal growth. It provides opportunities to develop leadership skills, engage in extracurricular activities, and build a professional network that can benefit your career.
- Career Advancement: A four-year degree is often a stepping stone for career advancement, especially for those aiming for managerial or specialized roles. It can also serve as a foundation for pursuing further education, such as a master's or doctorate degree.
These benefits underscore why many students choose to invest in 4 year degrees, as it can significantly shape their future career path and earning potential.
How Do Specialized Online Programs Enhance Career Opportunities?
Specialized online programs offer focused curricula that equip students with industry-specific skills, accelerating their readiness for today's dynamic job market. In particular, these programs deliver practical training, refined methodologies, and flexible learning schedules that reinforce academic knowledge with real-world application. For instance, prospective students interested in health science can explore tailored courses that merge theory with practice, thereby enhancing their professional profile through credentials such as the kinesiology degree online.
What is the Return on Investment of a University Education?
Evaluating the return on investment (ROI) of a university education entails a detailed analysis of cumulative costs against long-term career benefits. This approach examines tuition and ancillary expenses alongside post-graduate earnings, career progression, and industry demand. In this context, targeted master’s programs often demonstrate a measurable boost in income potential; for further insight into lucrative options, refer to highest-paying master degrees. Such assessments enable prospective students to align educational investments with evolving economic conditions and sector-specific opportunities.
Universities Remain as Key Components of Global Progress
A university is an important element for a nation that wants to progress. As such, more institutions and university programs are popping up all around the world. The belief that educational attainment is a good way of improving the socioeconomic status of aspiring students and their families is increasingly becoming more convincing. As a result, more students are enrolling at universities to pursue a study of higher knowledge, even at its financial cost. Some even brave the hardest majors ranked by average GPA—even if they are not their first choice—provided that they pay well.
Data related to universities are impossible to enumerate in a single article and thus, higher education students and educators alike are advised to read more about them to remain abreast of the different issues surrounding the topic. Trends are also on the constant shift so being on the lookout for something that could be of impact to them is a big help in anticipating the important information regarding higher education in the coming years.
Key Insights
- Growing Educational Attainment: The percentage of adults in the U.S. with college degrees has steadily increased, reaching 38.7% in 2024.
- Global University Presence: There are over 25,000 universities worldwide, with Europe and Asia having the highest number of recognized institutions.
- Financial Overview: The global higher education market was valued at $1,042.31 billion in 2025 and is projected to reach $3,024.89 billion by 2035.
- Enrollment Trends: In fall 2025, the total undergraduate enrollment in the U.S. was 16.2 million, up 1.2%.
- Cost of Education: The cost of studying varies significantly by institution and country, with tuition fees ranging from $1,000 in Spain to $51,870 at Princeton University for full-time students.
- Diversity in Institutions: The U.S. has a diverse mix of public, private, non-profit, and for-profit universities, with California having the highest number of institutions.
- University Funding: Universities receive funding from various sources, including federal grants, private gifts, and endowment funds, with Harvard having the largest endowment market value at $39.4 billion.
- Dropout Rates: Financial constraints and academic challenges are the leading causes of student dropouts, with 30% of freshmen dropping out and an overall dropout rate of 40% for undergraduate students.
References:
- Hanson, M. (2025). College Graduation Statistics. Education Data Initiative. https://educationdata.org/number-of-college-graduates
- imarc. (2026). United States Higher Education Market Size and Share. https://www.imarcgroup.com/united-states-higher-education-market
- Ivy Coach. (n.d.). Ivy League Statistics by Schools. Retrieved April 2026, from https://www.ivycoach.com/ivy-league-admissions-statistics
- Ma, J., Pender, M., & Hu, X. (2025). Trends in College Pricing and Student Aid 2025. College Board. https://research.collegeboard.org/media/pdf/Trends-in-College-Pricing-and-Student-Aid-2025-final_1.pdf
- National Center for Education Statistics. (n.d.). Trend Generator - Institutional Revenues. Retrieved April 2026, from https://nces.ed.gov/ipeds/trendgenerator
- National Student Clearinghouse Research Center. (2026, January 15). Final Fall Enrollment Trends. https://nscresearchcenter.org/final-fall-enrollment-trends
- Precedence Research. (2026). Higher Education Market Size, Share and Trends 2026 to 2035. https://www.precedenceresearch.com/higher-education-market
- Schwartz, N. (2026). How higher ed would fare in Trump’s latest budget proposal. Higher Ed Dive. https://www.highereddive.com/news/how-higher-ed-would-fare-in-trumps-latest-budget-proposal/816653
- Statista. (2026). Educational attainment in the U.S. 1960-2024. https://www.statista.com/statistics/184260/educational-attainment-in-the-us
Other Things You Should Know About University Statistics
By 2026, U.S. university enrollment trends show a shift towards increasing numbers in online programs and part-time enrollment. Traditional full-time on-campus numbers have seen a decline, as students balance education with work and other responsibilities, adapting to flexible learning formats.
There are over 25,000 universities around the world, with Europe and Asia having the highest number of recognized institutions.
The percentage of adults that graduated college in 2024 was 38.7%.
The global higher education market was valued at $1,042.31 billion in 2025 and is projected to reach $3,024.89 billion by 2035.
In fall 2025, the total undergraduate enrollment in the U.S. was 16.2 million, up 1.2%. Meanwhile, the graduate enrollment was 3.2 million, down 0.3%.
Tuition fees vary significantly, ranging from $1,000 in Spain to $51,870 at Princeton University for full-time students.
California has the highest number of universities, with 259 four-year schools and 161 two-year institutions.
Universities receive funding from federal grants, private gifts, endowment funds, student tuition and fees, and investment returns.
The pandemic has introduced significant financial uncertainties, especially for smaller institutions that may suffer major setbacks.
Financial constraints and academic challenges are the leading causes, with 30% of freshmen dropping out and an overall dropout rate of 40% for undergraduate students.
In public 4Y institutions, tuition and fees cost $11,950 in-state and $31,880 out-of-state. However, the net cost of attendance after financial aid was $21,340 in public 4Y institutions.


